Tables, bar charts, and graphs - how to construct them in order to present data
Judy Zapinsky
45 Followers
Grade Levels
7th - 10th, Homeschool
Subjects
Resource Type
Formats Included
- Zip
Pages
28 pages
Judy Zapinsky
45 Followers
Description
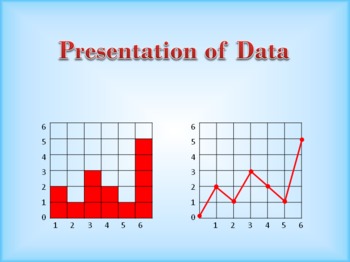
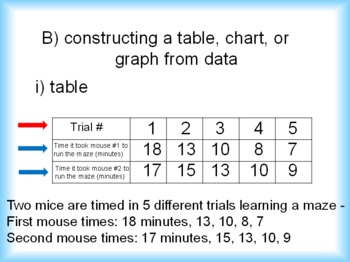
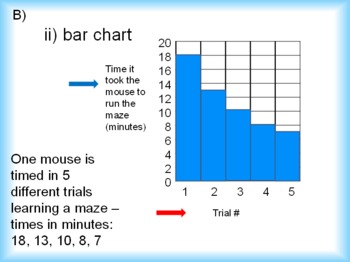
By the time students reach middle school, they have learned how to fill in the data on a table, bar chart, and graph, but they still need to learn how to create (construct, make, or draw) one from scratch. This is a PowerPoint presentation, with lecture notes and associated worksheets, that demonstrates how to present data clearly, by constructing tables, bar charts, and graphs from raw data. It covers topics such as the relationship between independent and dependent information (variables), a mnemonic to help your students remember where to locate the independent and dependent information on the table/bar chart/graph, which information to include in the labels, placement of numbers on each axis, and how to fill out the inside of the table/bar chart/ or graph. Lecture notes include arrows indicating where to click the mouse to advance the PowerPoint slides. A separate set of PowerPoint slides is provided for working out the answers with the entire class as the students practice. Note - this is a straightforward presentation, without pictures of people or characters. It is also part of my bundled packages of lesson plans. Created by Judy Zapinsky
Tables, bar charts, and graphs - how to construct them in order to present data by Judy Zapinsky is licensed under a Creative Commons Attribution 3.0 Unported License.
Tables, bar charts, and graphs - how to construct them in order to present data by Judy Zapinsky is licensed under a Creative Commons Attribution 3.0 Unported License.
Total Pages
28 pages
Answer Key
N/A
Teaching Duration
N/A
Report this resource to TPT
Reported resources will be reviewed by our team. Report this resource to let us know if this resource violates TPT’s content guidelines.


