11 results
Graphing lectures for Google Apps
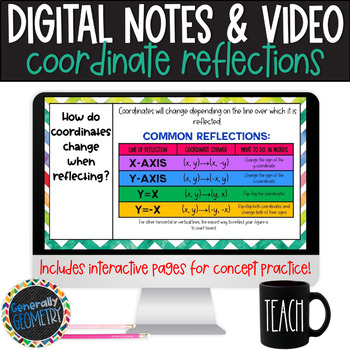
Coordinate Reflections Geometry Digital Guided Notes and Video
About this resource:Do your students struggle with coordinate reflections? Tired of printing notes packets? This set of guided Geometry notes is engaging, paperless, and no prep! This set of notes teaches the concept of REFLECTIONS ON THE COORDINATE PLANE. Topics covered:Reflections over the x-axisReflections over the y-axisReflections over the line y=xReflections over the line y=-xReflections over other horizontal or vertical linesPlease see the preview for details!What are digital notes?Digita
Grades:
7th - 12th
CCSS:
Also included in: Geometry Digital Guided Notes and Resource Bundle
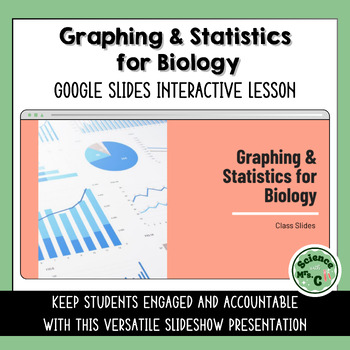
Graphing & Statistics for Biology Google Slides Lesson
Features a Google Slides lesson/presentation that reviews how to make scientific data tables, graph scientific data, and calculate mean, median, mode, and range.The topics covered in this presentation include:Identifying types of DataConstructing Data TablesCalculating Mean, Median, Mode, Range & Standard DeviationPlotting a GraphInterpolation & Extrapolation of DataKeep your students engaged and accountable with this interactive, versatile presentation. Embedded within these 27 colorful
Subjects:
Grades:
6th - 12th

IB Math Applications Lecture Slides: Graph Theory (HL Only)
Lecture slides with guided practice and independent practice problems. Aligned with Haese textbook for IB Mathematics Applications and Interpretations HL course.
Subjects:
Grades:
11th - 12th
Types:
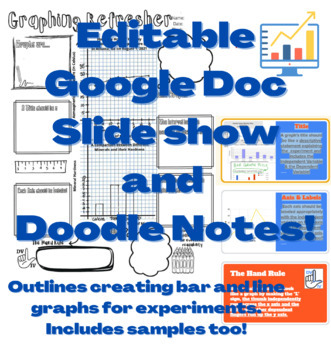
Scientific Graphing EDITABLE Google Slide Show with Keys and Doodle Note Sheet
This Slide Show does a wonderful job outlining key aspects of graphs including: Line and bar graphs, accurate titling, axis, and scaling. The doodle note sheet gives two examples of correct graphs, in addition to encouraging students creativity. It will help your students create their own graphs to represent their data in future experiments from start to finish.
Grades:
5th - 9th
Types:

Creating Data Tables and Graphs (Lesson 3)
Lesson 3: Creating Data Tables and Graphs contains a full lesson plan with various games, worksheets, and a presentation to engage students in collecting and organizing data into a table and graph. There are multiple activities to choose from that will allow you to begin the process of converting your classroom from a teach-centered approach to a student-centered approach that will allow you the freedom to monitor student work and engagement as well as focus on students with learning gaps.
Grades:
9th - 12th
Types:
Also included in: Unit 1: The Scientific Method Bundle
Introduction to Data Visualization - Google Slides Presentation
This fully editable Google Slides presentation introduces key concepts and considerations in data visualization, including:the history of data visualizationan introduction to the benefits and importance of data visualizationtypes of visualizationshow to choose a visualization typedata visualization design principles and best practicesleading data visualization platformsthe differences between raster and vector graphicskey considerations when thinking about creating a visualizationUse this as par
Subjects:
Grades:
6th - 12th, Higher Education, Adult Education
Also included in: Graphic Design Growing Bundle
Distance and Midpoint on a Coordinate Plane Notes
This product is a Google Slides presentation with a student & teacher version of notes. You can easily print the student version which has fill in the blank style notes. Print the teacher version as a key and write on the board along with students. You may also present the teacher version to class during lecture. Includes examples of distance and midpoint on a coordinate plan and guided practice problems for class to work on. This product is easy to post on your Google Classroom too for stu
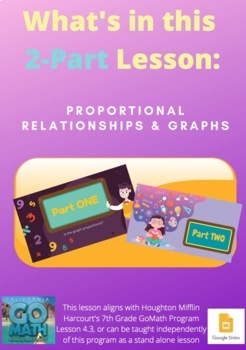
Proportional Relationships & Graphs - 4.3
Great for virtual learning or in person learning! Can be displayed in google meet, on a smart board, or easily turned into an interactive experience like PearDeck. You can even film yourself teaching from these slides using programs like Screencastify!This lesson walks teacher and students through a Two Part Lesson:Part One: Identifying a Proportional Graph & Creating a Proportional GraphPart Two: Writing & Graphing proportional graphs in the y-kx formatIncreasing gradually in difficulty

Graphing - All kinds of graphs!
This walks students through numerous graphs, breaking down how/why/when to use them.Bar, line, pie, histogram, scatter plot and more!
Linear Equations and Functions (google slides)
Google Presentation created with the use of "Everything You Need To Ace Math In One Big Fat Notebook"
Grades:
8th - 9th
Types:

Graphing and Constant of Proportionality
Notes over graphing and constant of proportionality. I use these notes to go over the concepts and to work through examples with the students.
Grades:
6th - 7th
Showing 1-11 of 11 results


