High School Data Analysis Project
Toria Enterprises
56 Followers
Grade Levels
9th - 12th
Subjects
Resource Type
Standards
CCSSHSS-ID.A.1
CCSSHSS-ID.A.2
CCSSHSS-ID.A.3
CCSSHSS-ID.A.4
CCSSHSS-ID.B.5
Formats Included
- Zip
Pages
12 pages
Toria Enterprises
56 Followers
What educators are saying
What a great overall data project. I only used the parts related to one-variable data. With today's controversies, I actually had students complain about having to write their gender. Geesh.
My students were so engaged in this activity. I had them interview other students around the school and the skills they learned from that part of the activity alone was wonderful. This is great for all students, thank you!
Description
This project covers a large range of data analysis methods. There are eleven total parts to the project.
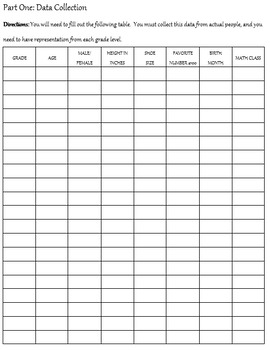
Part One: the students have to collect data from 20 students outside of the classroom. Directions specify to ask students from each grade level.
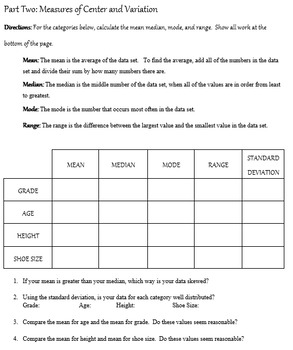
Part Two: Measures of Center and Variation. Students will calculate mean, median, mode, range, and standard deviation for some of the data collected. Definitions of each term are included.
Part Three: Box-And-Whisker Plot. Students will create two box-and-whisker plots based off specified data they collected. Directions and an example are included.
Part Four: Bar Graph vs. Histogram. Students will create one bar graph and one histogram based off specified data they collected. (Great for discussion about the differences between the two)
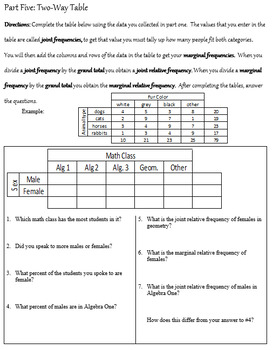
Part Five: Two-Way Table Students will use specified data they collected to create two two-way tables. Directions and an example are included.
Part Six: Types of Data. Students will determine if the data they collected is qualitative or quantitative. They will also create six more examples of data that they could have collected and determine if those are qualitative or quantitative.
Part Seven: Stem and Leaf Plot. Students will create two stem and leaf plots. Directions and an example are provided.
Part Eight: Dot-Plot. Students will create two dot-plots.
Part Nine: Scatter Plot and Correlation vs. Causation. Students will create a scatter plot and then discuss/analyze the difference between causation and correlation.
Part Ten: Line of Best Fit, Predictions, and Percent Error. Students will use the scatter plot from part nine and create a line of best fit. They will also make predictions based off this data, and determine the accuracy of their line.
Part Eleven: Reflection and Summary. Students will write an essay summarizing what they have learned through this project. There are prompt questions to guide their writing.
Purchase includes both a PDF file and a Microsoft Word file.
PROJECT DOES SPECIFY GRADES 9-12
Updated 3-15-18
Total Pages
12 pages
Answer Key
N/A
Teaching Duration
3 days
Report this resource to TPT
Reported resources will be reviewed by our team. Report this resource to let us know if this resource violates TPT’s content guidelines.
Standards
to see state-specific standards (only available in the US).
CCSSHSS-ID.A.1
Represent data with plots on the real number line (dot plots, histograms, and box plots).
CCSSHSS-ID.A.2
Use statistics appropriate to the shape of the data distribution to compare center (median, mean) and spread (interquartile range, standard deviation) of two or more different data sets.
CCSSHSS-ID.A.3
Interpret differences in shape, center, and spread in the context of the data sets, accounting for possible effects of extreme data points (outliers).
CCSSHSS-ID.A.4
Use the mean and standard deviation of a data set to fit it to a normal distribution and to estimate population percentages. Recognize that there are data sets for which such a procedure is not appropriate. Use calculators, spreadsheets, and tables to estimate areas under the normal curve.
CCSSHSS-ID.B.5
Summarize categorical data for two categories in two-way frequency tables. Interpret relative frequencies in the context of the data (including joint, marginal, and conditional relative frequencies). Recognize possible associations and trends in the data.


