1,873 results
10th grade statistics worksheets
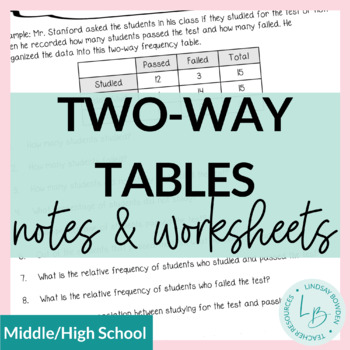
Two-Way Frequency Tables Notes and Worksheets
These two-way frequency table notes and worksheets are meant for an Algebra 1 statistics unit. However, they can also be used in middle school. They cover:Reading two-way frequency tablesFinding joint, marginal, and conditional relative frequenciesCreating two-way frequency tablesSee preview to view all pages! 4 pages + answer keys.You may also like:Two-Way Frequency Tables Task CardsBox and Whisker Plots Notes & WorksheetsHistograms Notes & WorksheetsTerms of Use:This product should onl
Subjects:
Grades:
8th - 10th
CCSS:
Also included in: Statistics Unit Bundle
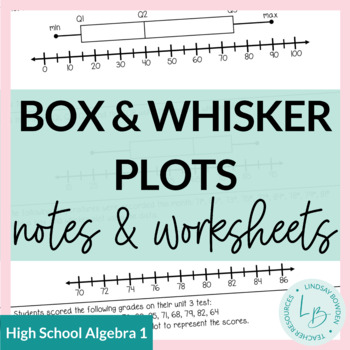
Box and Whisker Plots Notes and Worksheets
These notes and worksheets cover:RangeQuartiles and Interquartile RangeBox and Whisker PlotsIncludes 2 pages of notes and 2 worksheets. Answer keys included! These are meant for an Algebra 1 class, but can also be used for middle school (Texas standards for 7th grade). You may also like:Mean, Median, and Mode Notes & WorksheetsHistograms Notes & WorksheetsComparing Data: Spread, Shape, and Center Notes & WorksheetsTerms of Use:This product should only be used by the teacher who purch
Subjects:
Grades:
8th - 10th
CCSS:
Also included in: Statistics Unit Bundle

SAT Math Test Prep Bundle
Updated for 2024! If you are preparing students for college entrance exams in math for the SAT or PSAT, then this will be a life saver! This is a bundle of all 6 of my SAT reviews. As high school math teachers, we should be preparing our students to succeed on college entrance exams. The students need to become familiar with the types of questions they will see and how they will be asked. Read further to see the topics and a little about each activity below:Some of the topics covered are:Systems
Subjects:
Grades:
10th - 12th
Types:
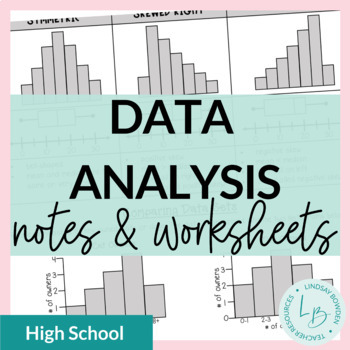
Data Analysis: Shape, Center, and Spread Notes and Worksheets
These data analysis notes and worksheets compare two data sets with regards to shape, center, and spread of data.They cover:comparing data of two sets using histograms, dot plots, box and whisker plots,and stem and leaf plotsshape (symmetrical, skewed right, skewed left)center (mean, median)peaks (mode)spread analyzing what these factors mean in context of the problem4 pages + all answer keysYou may also like:Mean, Median, and Mode Notes & WorksheetsBox and Whisker Plots Notes & Workshee
Subjects:
Grades:
8th - 10th
CCSS:
Also included in: Statistics Unit Bundle
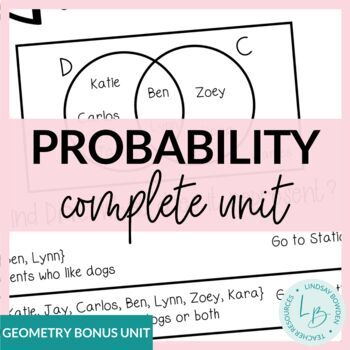
Probability Unit Bundle
Get a complete High School Compound and Conditional Probability unit including lessons on set theory, outcomes, and basic, compound, and conditional probability, and more! These ready-to-use resources include everything you need to teach high school probability to your on-level or lower-level/special education class. Supplements would be needed for an honors class.This is a bonus unit that's included in my Geometry Curriculum.Each unit contains guided notes, practice worksheets for the classroo
Subjects:
Grades:
9th - 11th
Types:
CCSS:
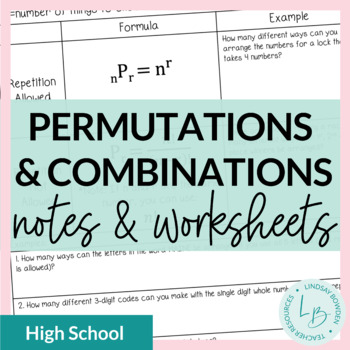
Permutations and Combinations Notes & Worksheets
These permutations and combinations guided notes cover:intro to permutations, combinations, and factorialsintro to finding permutations (with and without repetition) intro to finding combinations (with and without repetition)2 practice worksheets with permutations and combinations**NOTE: This does not include finding compound probabilities with permutations/combinations. It only covers finding the number of outcomes using permutations and combinations.I included two versions of the combination n
Subjects:
Grades:
9th - 11th
Also included in: Probability Unit Bundle
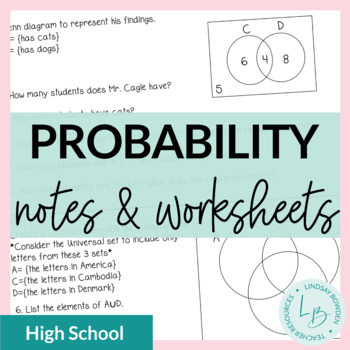
Probability Guided Notes and Worksheets
These probability notes and worksheets cover all of the compound and conditionality probability standards for high school. Topics covered: set theory (union, intersection, complement, Venn diagrams) outcomes and basic probability (coins, dice, tree diagrams, Fundamental Counting Principle)compound probability (addition and multiplication rules) conditional probability (both independent and dependent) Students must have a basic knowledge of a standard deck of playing cards to complete some of the
Subjects:
Grades:
9th - 11th
Types:
CCSS:
Also included in: Probability Unit Bundle
Counting Outcomes and the Fundamental Counting Principle Guided Notes & Homework
* Download the preview for details! *This lesson includes 2 pages of guided notes and a 2-page assignment. Students learn about the fundamental counting principle in the order below. They will:- Discover the concept through tree diagrams- Practice applying it to different situations (dice, outfits, spinners, etc.)- Discover how many different Ohio license plates are possible- Relate the fundamental counting principle to probabilityAnswer key is included!* This lesson leads into my Permutations a
Subjects:
Grades:
6th - 12th
Histograms Notes and Worksheets
These histograms notes and worksheets are meant to be a review of histograms for an Algebra 1 statistics unit. They cover:Reading and Interpreting HistogramsCreating Histograms See preview to view all pages! 3 pages + answer keys. You may also like:Box and Whisker Plots Notes & WorksheetsTerms of Use:This product should only be used by the teacher who purchased it. This product is not to be shared with other teachers. Please buy the correct number of licenses if this is to be used by more th
Subjects:
Grades:
8th - 10th
CCSS:
Also included in: Statistics Unit Bundle
Statistics Unit Bundle
This is a complete statistics unit for an Algebra 1 course. All assessments (quizzes, study guide, and test) are editable to fit your needs. This unit is included in my Algebra 1 Curriculum.*Note: This unit is best suited for on-level or lower-level/special education math classes. Supplements will most likely be needed for an honors or upper-level math class.*This unit now contains video lessons for every lesson!*Topics Covered:Mean, Median, Mode ReviewStem and Leaf PlotsHistogramsDot PlotsRange
Subjects:
Grades:
8th - 10th
CCSS:
Analyzing Plots, Graphs, and Tables using Measures of Central Tendency
This product provides students the opportunity to analyze data presented in different ways. By making calculations and analyzing data, students make conjectures and justify them using mathematical reasoning and evidence!What is included?This product contains 8 student work pages. Each work page contains a set of data displayed graphically with accompanying questions. The data displays included are 2 dot plots, 2 bar graphs, 2 frequency tables, and 2 stem-and-leaf plots. Students are required
Subjects:
Grades:
5th - 11th
Types:
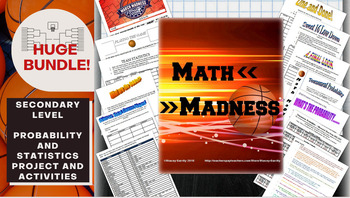
Math March Madness Full Tournament Project {BUNDLE}
Harness the excitement of NCAA March Madness with this huge project for secondary math teachers that follows all stages of the tournament! This Common Core aligned bundle comes with bonus parts not sold individually in my store so you can create a rich immersion in the tournament, practice probability and statistics and learn some interesting new ones along the way! Save $3 plus get bonus content by bundling!You can pick and choose which parts you would like to incorporate, or follow my schedu
Subjects:
Grades:
6th - 12th, Higher Education
Types:
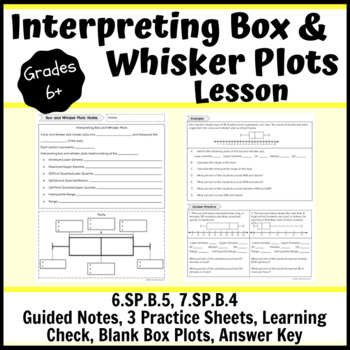
Interpreting Box and Whisker Plots Lesson- Notes, Practice, Learning Check
This interpreting box and whisker plots lesson consists of a guided notes sheet, 3 practice sheets, a learning check, 2 different half sheets of blank box plots and an answer key. You can hole punch the note pages and have students place them in their binders or a 3-prong folder. There are teacher notes to guide you through the direct instruction with students. There are three pages of practice. One page can be used as independent practice when students are ready; this could be in class or homew
Subjects:
Grades:
6th - 10th
Types:
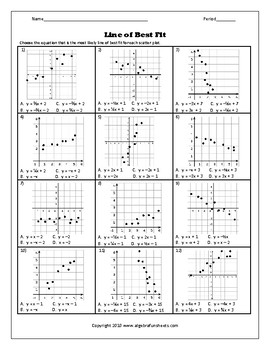
Linear Equations - Scatter Plots and Line of Best Fit Worksheet 2
This is a linear equations scatter plots and line of best fit worksheet.Standard worksheetMultiple choiceNo calculations requiredFrom a scatter plot graph, students will pick the equation that is most likely the line of best fit.This product is included in the Linear and Quadratic Regression Bundle* If you are already an Algebrafunsheets.com subscriber, you already have access to this and over 400+ worksheets. ** Worksheets are copyright material and are intended for use in the classroom only.
Subjects:
Grades:
7th - 11th
Types:
Also included in: Line of Best Fit and Quadratic Regression (Bundle)
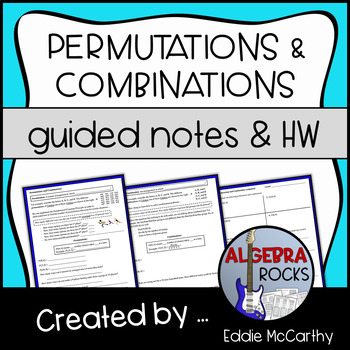
Permutations and Combinations Notes - Guided Notes and Homework
* Download the preview for details! ** This lesson follows my Counting Outcomes and the Fundamental Counting Principle lesson. Click the link to check it out!This lesson includes 2 pages of guided notes and a 1-page assignment. Students learn about permutations and combinations in the order below. They will:- Learn the definition of permutation and what we mean by “order matters”- Discover how to calculate permutations by applying the fundamental counting principle to runners in a race- Practice
Subjects:
Grades:
6th - 12th
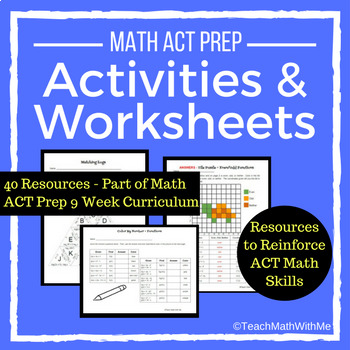
Math ACT Prep Activities and Worksheets - ACT Math Skills
This set includes 40 activities and worksheets that can be used to practice and reinforce ACT math skills. The topics range across the 6 main ACT areas (Integrating Essential Skills, Numbers & Quantity, Algebra, Functions, Geometry, and Statistics & Probability).The answer keys are included. The activities and worksheets include both individual and partner/group work.** These worksheets are included in my Math ACT Prep Curriculum 9 week product and within the appropriate individual uni
Subjects:
Grades:
9th - 12th
Types:
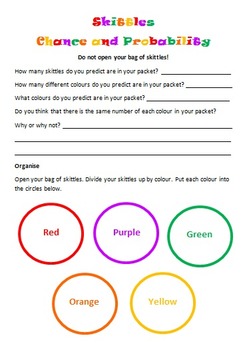
Skittles Chance and Probability (Editable)
Chance and Probability activity using yummy Skittles!!!
Students are to predict the colours and quantities before they open the skittles bag. Students are to complete a chance experiment where they use a tally to collect their data. Students then transfer their data in fractions, decimals and percentages. Students are to create a bar graph using their data as well as answer chance and probability questions about the data. I used this with my grade 5/6 students and they loved it!
Subjects:
Grades:
3rd - 10th
Types:
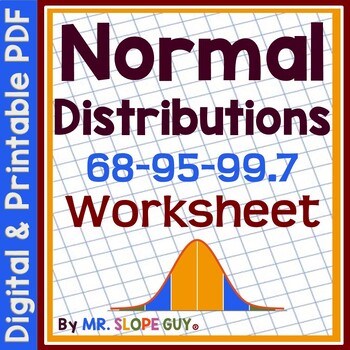
Normal Distributions Empirical Rule Worksheet
Hello Math Teachers! Do you want to help your students understand normal distributions and apply the Empirical Rule (64-95-99.7)? This worksheet can help! Students will practice interpreting real-world examples to find percentages, probability, and estimate data statements from distributions. They will also label parts of normal distributions when given mean and standard deviation, and identify key data points from the graphical distribution of data.This two-sided worksheet comes with an easy-to
Subjects:
Grades:
10th
Types:
CCSS:
Also included in: Data and Statistics Worksheets Bundle
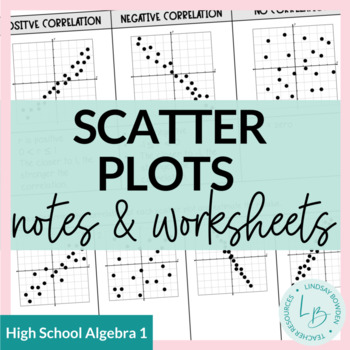
Scatter Plots Notes and Worksheets
These scatter plots notes and worksheets are meant for an Algebra 1 statistics unit. They cover:Linear, Quadratic, and Exponential Scatter Plots (very basic)Linear Scatter Plots in more detail Correlation CoefficientCorrelation vs. CausationLine of Best Fit (estimating from a graph)Linear Regression (using a graphing calculator)10 pages + answer keys.You may also like:Box and Whisker Plots Notes & WorksheetsHistograms Notes & WorksheetsTerms of Use:This product should only be used by the
Subjects:
Grades:
8th - 10th
CCSS:
Also included in: Statistics Unit Bundle
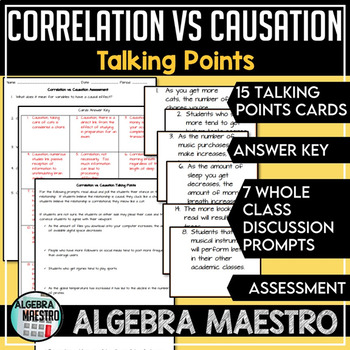
Correlation vs. Causation Talking Points, Prompt & Assessment
The Correlation vs. Causation Talking Points includes task cards, prompts to incorporate discussion, and an assessment. The task cards and assessment have answer keys attached with brief explanations. There are 15 task cards where students can work individually, pairs, or small groups identifying whether cards form a correlation or causation relationship. In the Talking Points, this is designed to be whole class where students take a side on what they believe a passage to be. The assessment
Subjects:
Grades:
5th - 12th
Types:
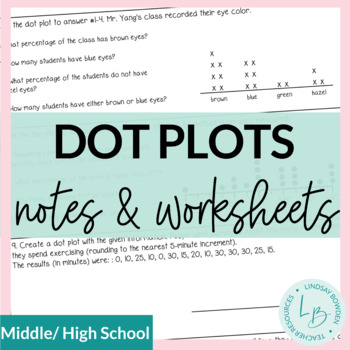
Dot Plots Notes and Worksheets
These dot plots notes and worksheets are meant to be a review of dot plots for an Algebra 1 statistics unit. They cover:Reading and Interpreting Dot PlotsCreating Dot PlotsSee preview to view all pages! 2 pages + answer keys.You may also like:Box and Whisker Plots Notes & WorksheetsHistograms Notes and WorksheetsTerms of Use:This product should only be used by the teacher who purchased it. This product is not to be shared with other teachers. Please buy the correct number of licenses if this
Subjects:
Grades:
8th - 10th
CCSS:
Also included in: Statistics Unit Bundle
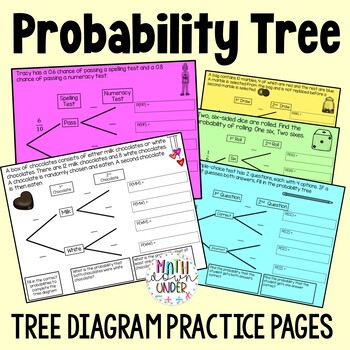
Probability Tree Diagrams Practice Pages - Independent and Dependent Events
Your students will love practicing drawing tree diagrams to solve compound probability events with these 10 printable practice pages. Independent and Dependent events are included.Starting with structured scaffolding, students are introduced to the process of creating probability trees by filling in the blanks. This approach builds confidence and ensures students grasp the fundamentals before advancing. Gradually, the scaffolding is removed, presenting blank templates that encourage students to
Subjects:
Grades:
6th - 10th
Types:
Also included in: Compound Probability Activity & Practice Bundle
8th Grade Statistics Project- Scatter Plots: Analyzing Asthma
I created this project as a fun way for my 8th grade students to apply their knowledge of scatter plots in a meaningful way. They had a lot of fun!Students pretend to be biostatisticians investigating why asthma rates in a city are skyrocketing. Students get to uncover the environmental cause of the increased rates of asthma and investigate how different factors are associated with asthma attacks.Students get lots of practice: - creating scatter plots using a table of data- selecting an appropri
Subjects:
Grades:
8th - 10th
Types:
CCSS:
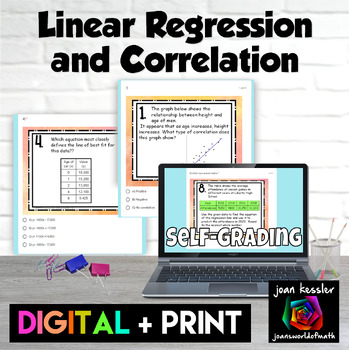
Linear Regression and Correlation Digital plus Print with TI-84 notes
This Linear Regression and Correlation activity is a great way for your students to practice their skills. There are 12 well chosen representative problems. Digital and printable PDF versions included. Questions include:CorrelationLine of Best FitProjecting TrendsFind the linear regression from a tableFind the linear regression from a scatter plotDetermining the correlation coefficientThe editable digital self checking version can be used as an Quiz, HW, or Paperless worksheet and is designed
Subjects:
Grades:
8th - 10th
Types:
CCSS:
Showing 1-24 of 1,873 results


