1,031 results
10th grade statistics homework
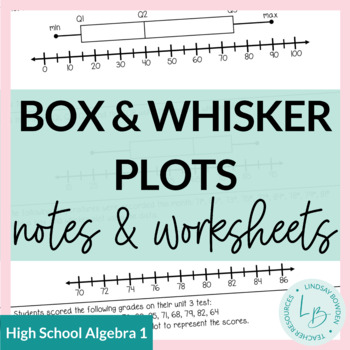
Box and Whisker Plots Notes and Worksheets
These notes and worksheets cover:RangeQuartiles and Interquartile RangeBox and Whisker PlotsIncludes 2 pages of notes and 2 worksheets. Answer keys included! These are meant for an Algebra 1 class, but can also be used for middle school (Texas standards for 7th grade). You may also like:Mean, Median, and Mode Notes & WorksheetsHistograms Notes & WorksheetsComparing Data: Spread, Shape, and Center Notes & WorksheetsTerms of Use:This product should only be used by the teacher who purch
Subjects:
Grades:
8th - 10th
CCSS:
Also included in: Statistics Unit Bundle
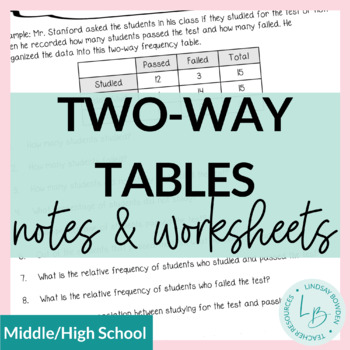
Two-Way Frequency Tables Notes and Worksheets
These two-way frequency table notes and worksheets are meant for an Algebra 1 statistics unit. However, they can also be used in middle school. They cover:Reading two-way frequency tablesFinding joint, marginal, and conditional relative frequenciesCreating two-way frequency tablesSee preview to view all pages! 4 pages + answer keys.You may also like:Two-Way Frequency Tables Task CardsBox and Whisker Plots Notes & WorksheetsHistograms Notes & WorksheetsTerms of Use:This product should onl
Subjects:
Grades:
8th - 10th
CCSS:
Also included in: Statistics Unit Bundle
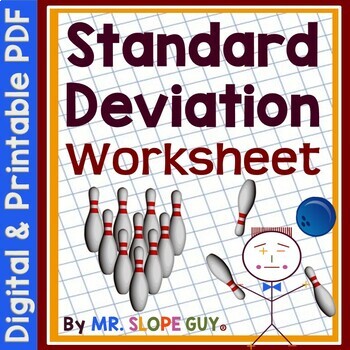
Standard Deviation Worksheet
Hello Math Teachers! Enhance your students' understanding of standard deviation, mean, range, and variance with this comprehensive worksheet on calculating standard deviation!This two-sided worksheet includes scaffolded questions to help students begin and interpret similarities and differences using real-world situations. It's perfect for Algebra 1 classes as homework or as a classwork activity, and would be a great addition to any statistics and data analysis unit.This worksheet comes with an
Subjects:
Grades:
10th
Types:
CCSS:
Also included in: Data and Statistics Worksheets Bundle
Goldie’s AP® Statistics UNIT 4 PLANS – Probability and Random Variables
AP Statistics Unit 4 – Probability, Random Variables, and Probability DistributionsUnit BundleThis unit contains everything you need to teach "Probability, Random Variables, and Probability Distributions" in AP® Statistics or regular-level Statistics. Students will go through how to calculate and interpret basic probabilities, conditional probabilities, and probabilities for the union and interception of two events; represent and interpret the probabilities for discrete and continuous random var
Subjects:
Grades:
10th - 12th
CCSS:
Also included in: Goldie's FULL CURRICULUM for AP® Statistics
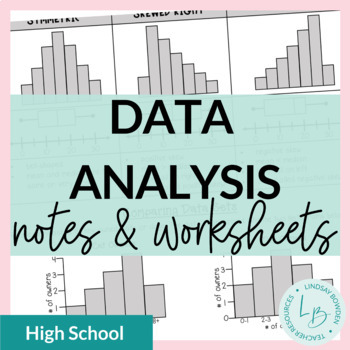
Data Analysis: Shape, Center, and Spread Notes and Worksheets
These data analysis notes and worksheets compare two data sets with regards to shape, center, and spread of data.They cover:comparing data of two sets using histograms, dot plots, box and whisker plots,and stem and leaf plotsshape (symmetrical, skewed right, skewed left)center (mean, median)peaks (mode)spread analyzing what these factors mean in context of the problem4 pages + all answer keysYou may also like:Mean, Median, and Mode Notes & WorksheetsBox and Whisker Plots Notes & Workshee
Subjects:
Grades:
8th - 10th
CCSS:
Also included in: Statistics Unit Bundle
Goldie’s AP® Statistics UNIT 5 PLANS – Sampling Distributions
AP® Statistics Unit 5 – Sampling DistributionsUnit BundleThis unit contains everything you need to teach "Sampling Distributions" in AP® Statistics or regular-level Statistics. Students will go through how to calculate probabilities involving the normal probability distribution; calculate and interpret parameters, check appropriate conditions, and calculate and interpret probabilities of a sampling distribution for sample proportions (and a difference in sample proportions); and calculate and in
Subjects:
Grades:
10th - 12th
Types:
CCSS:
Also included in: Goldie's FULL CURRICULUM for AP® Statistics
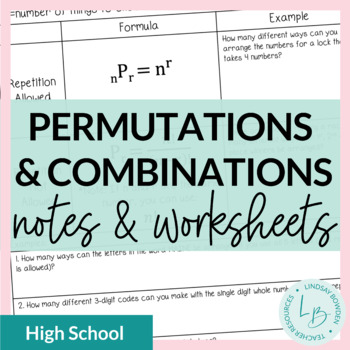
Permutations and Combinations Notes & Worksheets
These permutations and combinations guided notes cover:intro to permutations, combinations, and factorialsintro to finding permutations (with and without repetition) intro to finding combinations (with and without repetition)2 practice worksheets with permutations and combinations**NOTE: This does not include finding compound probabilities with permutations/combinations. It only covers finding the number of outcomes using permutations and combinations.I included two versions of the combination n
Subjects:
Grades:
9th - 11th
Also included in: Probability Unit Bundle
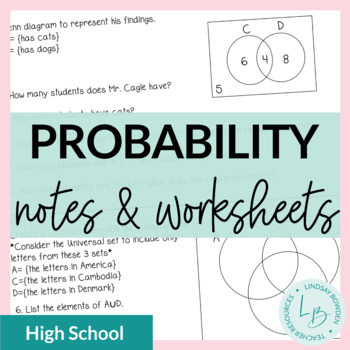
Probability Guided Notes and Worksheets
These probability notes and worksheets cover all of the compound and conditionality probability standards for high school. Topics covered: set theory (union, intersection, complement, Venn diagrams) outcomes and basic probability (coins, dice, tree diagrams, Fundamental Counting Principle)compound probability (addition and multiplication rules) conditional probability (both independent and dependent) Students must have a basic knowledge of a standard deck of playing cards to complete some of the
Subjects:
Grades:
9th - 11th
Types:
CCSS:
Also included in: Probability Unit Bundle
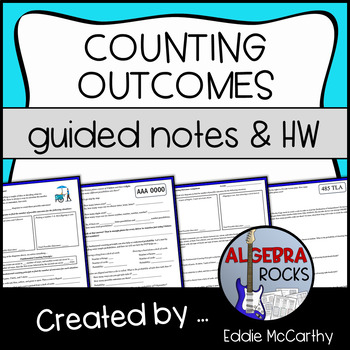
Counting Outcomes and the Fundamental Counting Principle Guided Notes & Homework
* Download the preview for details! *This lesson includes 2 pages of guided notes and a 2-page assignment. Students learn about the fundamental counting principle in the order below. They will:- Discover the concept through tree diagrams- Practice applying it to different situations (dice, outfits, spinners, etc.)- Discover how many different Ohio license plates are possible- Relate the fundamental counting principle to probabilityAnswer key is included!* This lesson leads into my Permutations a
Subjects:
Grades:
6th - 12th
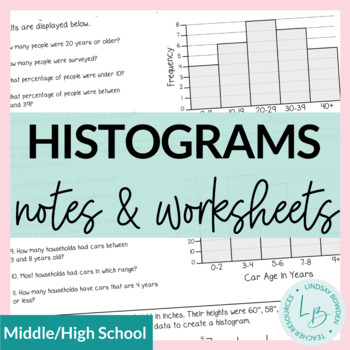
Histograms Notes and Worksheets
These histograms notes and worksheets are meant to be a review of histograms for an Algebra 1 statistics unit. They cover:Reading and Interpreting HistogramsCreating Histograms See preview to view all pages! 3 pages + answer keys. You may also like:Box and Whisker Plots Notes & WorksheetsTerms of Use:This product should only be used by the teacher who purchased it. This product is not to be shared with other teachers. Please buy the correct number of licenses if this is to be used by more th
Subjects:
Grades:
8th - 10th
CCSS:
Also included in: Statistics Unit Bundle
Goldie’s AP® Statistics UNIT 3 PLANS – Collecting Data
AP® Statistics Unit 3 – Collecting DataUnit BundleThis unit contains everything you need to teach "Collecting Data" in AP® Statistics or regular-level Statistics. Students will go through how to identify types of studies, sampling methods, and sources of bias in a study; compare and interpret the components of a well-designed experiment; and explain why a particular experimental design is appropriate. This unit is part of my larger unit bundle: Goldie's AP® Statistics Full Curriculum This produc
Subjects:
Grades:
10th - 12th
Types:
CCSS:
Also included in: Goldie's FULL CURRICULUM for AP® Statistics
Permutations and Combinations Notes - Guided Notes and Homework
* Download the preview for details! ** This lesson follows my Counting Outcomes and the Fundamental Counting Principle lesson. Click the link to check it out!This lesson includes 2 pages of guided notes and a 1-page assignment. Students learn about permutations and combinations in the order below. They will:- Learn the definition of permutation and what we mean by “order matters”- Discover how to calculate permutations by applying the fundamental counting principle to runners in a race- Practice
Subjects:
Grades:
6th - 12th
Goldie’s AP® Statistics UNIT 7 PLANS – Inference for Quantitative Data: Means
AP Statistics Unit 7 – Inference for Quantitative Data: MeansUnit BundleThis unit contains everything you need to teach "Inference for Quantitative Data: Means" in AP® Statistics or regular-level Statistics. Students will go through how to describe t-distributions and their properties; calculate, interpret, and justify a claim about a confidence interval for a population mean; identify the null and alternative hypotheses for a population mean and identify an appropriate testing method for a popu
Subjects:
Grades:
10th - 12th
Types:
CCSS:
Also included in: Goldie's FULL CURRICULUM for AP® Statistics
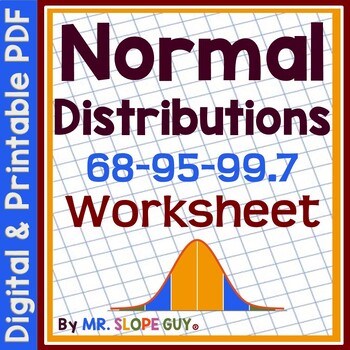
Normal Distributions Empirical Rule Worksheet
Hello Math Teachers! Do you want to help your students understand normal distributions and apply the Empirical Rule (64-95-99.7)? This worksheet can help! Students will practice interpreting real-world examples to find percentages, probability, and estimate data statements from distributions. They will also label parts of normal distributions when given mean and standard deviation, and identify key data points from the graphical distribution of data.This two-sided worksheet comes with an easy-to
Subjects:
Grades:
10th
Types:
CCSS:
Also included in: Data and Statistics Worksheets Bundle
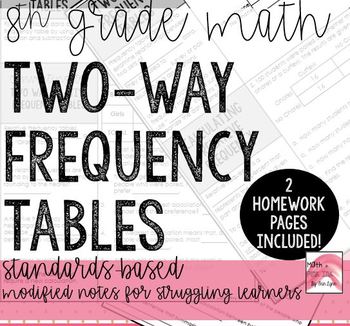
Two Way Frequency Tables and Relative Frequency Notes
NEW AND UPDATED FORMAT*
After careful study I am reformatting my notes to be easier to understand and be better resources for students. They will also more directly address the Common Core standards, and more specifically the Math Florida Standards (my home state).
I have designed this listing to directly address the listed standard for 8th grade, but it could be used in any grade covering frequency tables and relative frequency.
This PDF document contains:
1. Guided, two-column notes format
Subjects:
Grades:
8th - 10th
CCSS:
Goldie’s AP® Statistics UNIT 8 PLANS – Inference for Categorical Data Chi-Square
AP® Statistics Unit 8 – Inference for Categorical Data: Chi-SquareUnit BundleThis unit contains everything you need to teach "Inference for Categorical Data: Chi-Square" in AP® Statistics or regular-level Statistics. Students will go through how to set up hypotheses, check conditions, calculate the chi-square test statistic, interpret the p-value, and justify a claim using the Chi-Square Goodness of Fit Test, the Chi-Square Test for Homogeneity, and the Chi-Square Test for Association/Independen
Subjects:
Grades:
10th - 12th
Also included in: Goldie's FULL CURRICULUM for AP® Statistics
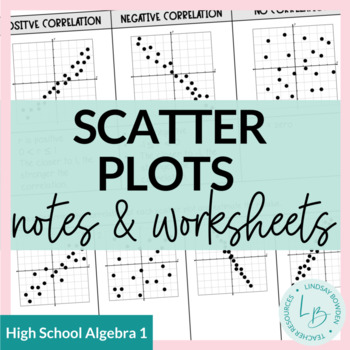
Scatter Plots Notes and Worksheets
These scatter plots notes and worksheets are meant for an Algebra 1 statistics unit. They cover:Linear, Quadratic, and Exponential Scatter Plots (very basic)Linear Scatter Plots in more detail Correlation CoefficientCorrelation vs. CausationLine of Best Fit (estimating from a graph)Linear Regression (using a graphing calculator)10 pages + answer keys.You may also like:Box and Whisker Plots Notes & WorksheetsHistograms Notes & WorksheetsTerms of Use:This product should only be used by the
Subjects:
Grades:
8th - 10th
CCSS:
Also included in: Statistics Unit Bundle
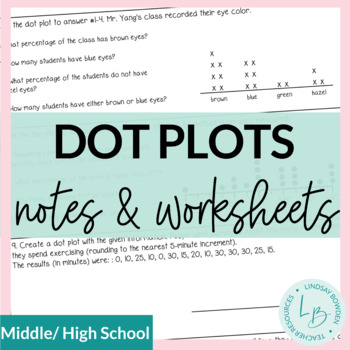
Dot Plots Notes and Worksheets
These dot plots notes and worksheets are meant to be a review of dot plots for an Algebra 1 statistics unit. They cover:Reading and Interpreting Dot PlotsCreating Dot PlotsSee preview to view all pages! 2 pages + answer keys.You may also like:Box and Whisker Plots Notes & WorksheetsHistograms Notes and WorksheetsTerms of Use:This product should only be used by the teacher who purchased it. This product is not to be shared with other teachers. Please buy the correct number of licenses if this
Subjects:
Grades:
8th - 10th
CCSS:
Also included in: Statistics Unit Bundle
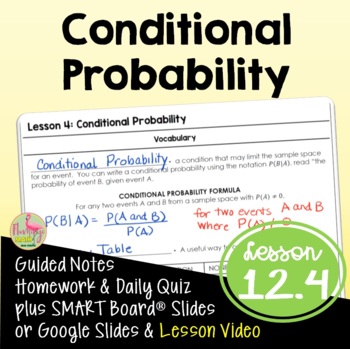
Conditional Probability (Algebra 2 - Unit 12)
Conditional Probability Algebra 2 Lesson:Your Pre-AP Algebra 2 Honors students will determine conditional probabilities, use tree diagrams and two-way tables in this Unit 12 lesson. #distancelearningtptWhat is included in this resource?⭐ Guided Student Notes⭐ Google Slides®⭐ Fully-editable SMART Board® Slides⭐ Homework/Practice assignment⭐ Lesson Warm-Up (or exit ticket)⭐ Daily Content Quiz (homework check)⭐ Video Lesson Link for Distance Learning - Flipped Classroom models⭐ Full solution setStu
Subjects:
Grades:
8th - 11th, Higher Education
Types:
CCSS:
Also included in: Algebra 2 Curriculum Mega Bundle | Flamingo Math
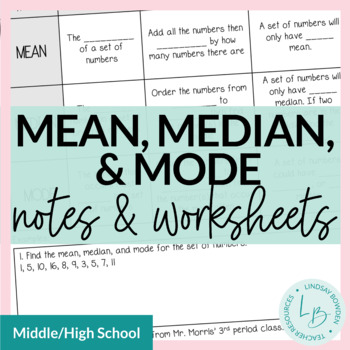
Mean, Median, Mode Notes and Worksheets (Measures of Central Tendency)
These mean, median, and mode notes and worksheets are meant to be a review of measures of central tendency for an Algebra 1 statistics unit. They cover:Finding Mean, Median, and ModeHow to know which is most appropriateSee preview to view all pages! 4 pages + answer keys.You may also like:Box and Whisker Plots Notes & WorksheetsHistograms Notes & WorksheetsTerms of Use:This product should only be used by the teacher who purchased it. This product is not to be shared with other teachers.
Subjects:
Grades:
8th - 10th
CCSS:
Also included in: Statistics Unit Bundle
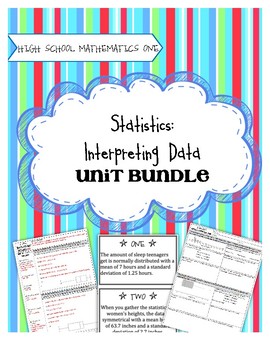
High School Math 1: Statistics and Interpreting Data
Task-Based Learning gets students intrinsically motivated to learn math! No longer do you need to do a song and dance to get kids interested and excited about learning. The tasks included in this unit, followed by solidifying notes and practice activities, will guarantee that students understand the concepts. This unit covers:
- Displaying one-variable data in a histogram, dot plot, or box plot
- Describing the distribution of data using statistical vocabulary
- Using data models and stati
Subjects:
Grades:
8th - 10th
Types:
CCSS:
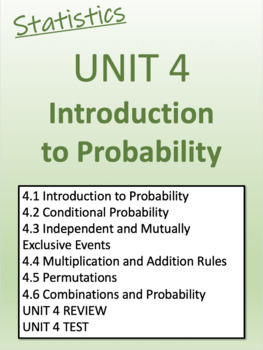
Statistics Unit 4--Introduction to Probability
Unit 4:4.1 Introduction to Probability4.2 Conditional Probability4.3 Independent and Mutually Exclusive Events4.4 Multiplication and Addition Rules4.5 Permutations4.6 Combinations and ProbabilityUNIT 4 REVIEWUNIT 4 TEST
Subjects:
Grades:
9th - 12th
Types:
Goldie’s AP® Statistics UNIT 9 PLANS – Inference for Quantitative Data: Slopes
AP Statistics Unit 9 – Inference for Quantitative Data: SlopesUnit BundleThis unit contains everything you need to teach "Inference for Quantitative Data: Slopes" in AP® Statistics or regular-level Statistics. Students will go through how to identify an appropriate confidence interval procedure, verify the conditions, calculate and interpret the interval for a slope of a regression model; and identify the null and alternative hypotheses, verify the conditions for making statistical inferences, c
Subjects:
Grades:
10th - 12th
Types:
Also included in: Goldie's FULL CURRICULUM for AP® Statistics
Probability - Tree Diagrams for independent and dependent events
To save you some time when you are preparing your lessons on dependent and independent events, I have collected a bunch of problems that can be solve by drawing tree diagrams and made a slide show of the questions and there answers. The tree diagrams are animated to enable you to explain as you go on. They can also be adjusted very easily and quickly to fit any other problems that you want you learners to solve.There are 6 examples of dependent events and 9 of independent events. I have also inc
Subjects:
Grades:
7th - 12th
Showing 1-24 of 1,031 results


