194 results
Adult education graphing lessons
Box and Whisker Plot Activity Bundle
This 21 page mini-lesson/bundle has 3 engaging assignments. Students are expected to find measures of central tendency, while creating and interpreting box and whisker plots. The activities are:
A group project where students use foldable strips to find their own minimum, maximum, and median, and then plot their own box and whisker plots.
They will also take data from local restaurants, find the central tendencies of the data and create box and whisker plots.
Lastly, students are expected t
Grades:
6th - 9th, Adult Education
Types:
Interpreting Graphs for the Middle & Junior High School: Book 2
Here is another set of data graphics for your students to analyze and interpret. Using survey results from the USA Today newspaper, students will be asked to explain what the graphics are illustrating. Each activity will ask the student to identify basic information presented in each graphic and make some projections based on the data given in the survey.
The activities in this packet are a great way to improve your student’s skills in taking apart graphic displays of information. Brin
Subjects:
Grades:
4th - 10th, Adult Education
Types:
Scatter Plot & Line of Best Fit/Trend Line Mini-Practice
This is a mini lesson on scatter plots. It starts with a giving the students a table and having them graph the data onto a scatter plot. They then find the trend line or the line of best fit and have to answer questions. This is a wonderful homework assignment with not too many questions. It also could serve as a station or in-class assignment.
Grades:
7th - 10th, Adult Education
Types:
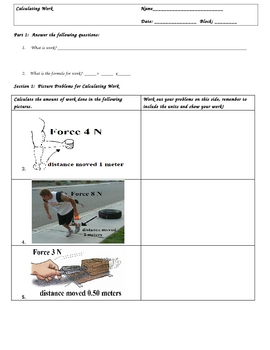
Calculating Work (W=Fxd) Worksheets and Key
Calculating Work (W=Fxd) Worksheets and KeyIf you have been teaching a Simple Machines or Energy Unit, then you need to check out this three page lesson to teach calculating work. It is in three sections.Section 1: Picture QuestionsSection 2: Word Problems/with Challenge QuestionsSection 3: Charting/Graphing ProblemsAll problems are worked out and the key is included.These worksheets include the renown Triangle Method, which has been a proven problem solver for students who struggle in math.The
Subjects:
Grades:
3rd - 12th, Higher Education, Adult Education

Excel Spreadsheets Million Dollars Activity
This resource allows students to understand the following: How graphs change when spreadsheet data is alteredUse of SUM() functionsHow graphs are madeComponents of a graphAdvantages of spreadsheets over pen and paper methodsStudents use this resource to understand how altering data in spreadsheets allow graphs to change. They understand such concepts by trying to spend a Million Dollars in a minute. Students are then expected to complete the associated worksheet which accompanies the spreadsheet
Grades:
5th - 12th, Adult Education
Types:
Function Packet: Write & Graph Functions and Creating Tables
This is a 38 page packet dedicated to teaching a 3 day mini unit on functions. Day one is recognizing patterns and creating patterns, day two is identifying variables and equations from word problems and tables, and day three is graphing functions! This is a very engaging unit with lots of real life connections! Each day has a warmup, notes, guided practice and independent practice, and an exit ticket! Answer key is included for each activity.
Subjects:
Grades:
5th - 8th, Adult Education
Types:
6th Grade - Coordinate Plane Powerpoint Lesson
6th Grade Coordinate Plane - This is perfect for distance learning on Zoom or similar formats. On top of that it is powerful when used as direct instruction in the classroom. It teaches students how to locate and name points in the coordinate plane in all 4 quadrants. In addition, they learn the terms and concepts of grid, coordinate plane, x axis, y axis, coordinate pair and rules governing the placement of plots. There are 22 effective teaching strategies based on research used in this le
Subjects:
Grades:
6th, Adult Education
Also included in: 6th Grade Powerpoint Mega Math Bundle - 58 Lessons - 2923 Slides
6th Grade Statistics & Data 1 - Statistical Questions & Types of Data Lesson
Sixth Grade Statistics 1 - Statistical Questions and Types of Data Powerpoint Lesson is powerful when used as direct instruction in the classroom, online, or individually. It teaches students how to recognize and pose a statistical question. Students also learn the difference between numerical and categorical data. They also learn the 4 basic steps in presenting data: posing a statistical question, gathering the data, displaying the data, and answering the question they posed. There are 22
Subjects:
Grades:
6th, Adult Education
CCSS:
Also included in: 6th Grade Statistics & Data Bundle - 6 Powerpoint Lessons - 402 Slides
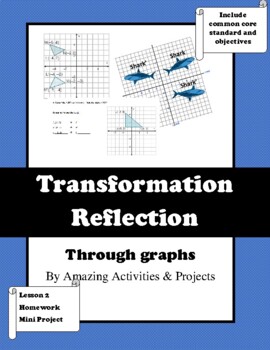
Transformation Reflection
This lesson #2 on reflection is designed for a Grade 8 math course aligned to Common Core or a geometry course. Also could be used in high school geometry course. The activities in this lesson require students to draw figures on coordinate plan to investigate reflection. Students will learn to use the mathematical notation for reflection. Common Core Standards: 8.G.A.1, 8.G.A.2, 8.G.A.3, 8.G.A.4, and 8.G.A.5Included in this download.★ Rules for translation★ Lesson notes and guided examples.★ Ho
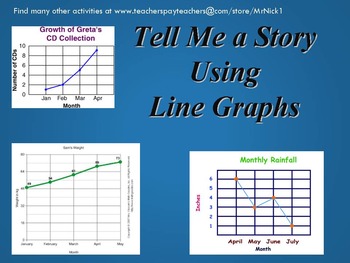
Tell me a Story using Line Graphs
Teach your students how to write across the curriculum. Want to know what your students are thinking? Here is a set of activities that will do just that. Hand out the graphic picture and the worksheet to each student or as a group assignment and ask them to complete the task. The observer or person looking at the graph is asked to tell a story presented in the graph. This packet gives each student the opportunity to “describe or tell the story” they see. You may then ask them to present th
Subjects:
Grades:
5th - 12th, Adult Education
Types:
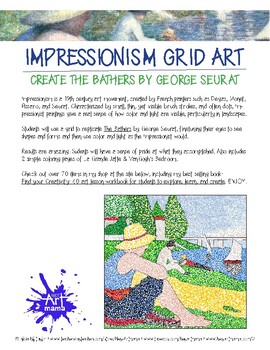
Learn about Impressionism and create artwork using pointallism and grids!
Impressionism is a 19th century art movement, created by French painters such as Degas, Monet, and Seurat. Characterized by small, thin, yet visible brush strokes, and often dots, Impressionist paintings give a real sense of how color and light play an important role in art, particularly when looking at landscapes.Students will use a grid to replicate The Bathers by George Seurat, finetuning their eyes to look at shape and form and learn to use color to create light, just as the Impressionist wo
Subjects:
Grades:
1st - 12th, Adult Education
Types:
Unit 1 All You Need to Teach Integers Math Foldable Book
This Unit is a collection of all my Integer Foldable combined
Into one. It includes: Absolute value and comparing Integers,
Integer Operations, and Coordinate Plane Foldables. Along
with number lines, pictures, vocabulary, rules, steps
Black masters and step by stem instructions.
You can glue this great learning tool into your Math notebook,
notes, Lap Book or just as a great resource to keep in your
binders. You can also make a wonderful wall display.
It’s a wonderful teaching and lea
Subjects:
Grades:
4th - 10th, Adult Education
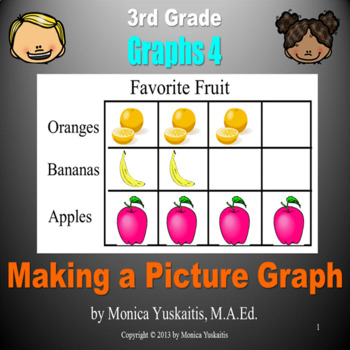
3rd Grade Graphs 4 - Making a Picture Graph Powerpoint Lesson
Third Grade Graphs 4 - Making Picture Graphs - This is perfect for distance learning on Zoom or similar formats. On top of that it is powerful when used as direct instruction in the classroom. It teaches students how to make a picture graph. In addition, the main parts of the picture graph are also taught. The following concepts are reviewed: grid, graph, coordinates, axes, scale, interval, title, and key. There are 22 strategies of effective teaching based on research in this powerpoint les
Subjects:
Grades:
3rd - 4th, Adult Education
CCSS:
Also included in: 3rd Grade Graphs Bundle - 6 Powerpoint Lessons - 277 Slides
3rd Grade Graphs 1 - Bar & Line Graphs Powerpoint Lesson
Third Grade Graphs 1 - Bar & Line Graphs introduces the students to graphs in general and emphasizes bar and line graphs. This is perfect for distance learning on Zoom or similar formats. On top of that it is powerful when used as direct instruction in the classroom. The following concepts are taught: grid, graph, coordinates, axes, scale, interval, title, key and how to solve problems using a bar or line graph. This lesson is based on 22 principles of effective teaching based on resear
Subjects:
Grades:
3rd - 5th, Adult Education
CCSS:
Also included in: 3rd Grade Graphs Bundle - 6 Powerpoint Lessons - 277 Slides
6th Grade Statistics & Data 3 - Dot Plot and Data Distribution Powerpoint Lesson
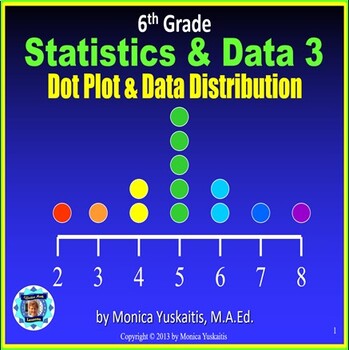
Sixth Grade Statistics 3 - Dot Plot and Data Distributions Powerpoint Lesson - is powerful when used as direct instruction in the classroom, online, or individually. It teaches students how to read and create dot plots. In addition, students learn to analyze the data as to its center, spread, and most common numbers. There are 22 strategies of effective teaching based on research. For best results, students should have white boards and dry erase markers. For instructions on how to successf
Subjects:
Grades:
6th, Adult Education
CCSS:
Also included in: 6th Grade Statistics & Data Bundle - 6 Powerpoint Lessons - 402 Slides
Algebra 1 Calculator Review (TI-84)
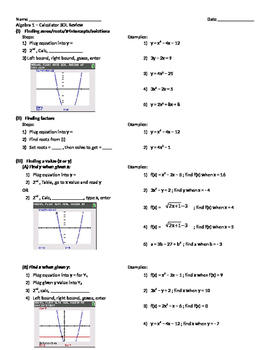
Comprehensive review of all graphing calculator concepts taught through the Algebra 1 course. Review concepts include finding roots, factors, values (x or y), y-intercept, mean, standard deviation, line/curve of best fit, and finding solutions to systems of equations. The review include steps and screenshots of the calculator.
Subjects:
Grades:
7th - 12th, Higher Education, Adult Education
6th Grade Statistics & Data 4 - Histogram Powerpoint Lesson
Sixth Grade Statistics 4 - Histogram Powerpoint Lesson is powerful when used as direct instruction in the classroom, online or individually. It teaches students how to identify a histogram and how to make one. Comparisons are made between a bar graph and a histogram. Many terms are defined such as axis, scale, frequency, count, range, interval, mound, skewed left, skewed right and more. There are 22 effective teaching strategies based on research used in this lesson. For best results, stud
Subjects:
Grades:
6th, Adult Education
Types:
Also included in: 6th Grade Statistics & Data Bundle - 6 Powerpoint Lessons - 402 Slides
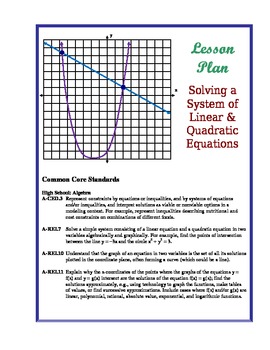
Solving Systems of Linear & Quadratic Equations Lesson Plan
This is a complete lesson plan for a double-period class. The lesson introduces a system of equations where one equation is quadratic and the other is linear. Students solve the system by graphing to find the point(s) where the graphs intersect.
There are several activities and examples to give students enough practice with the skill. (The lesson can be split to use for two single-period classes).
This lesson plan includes an opening activity, minilesson with guided steps through the process,
Grades:
9th - 11th, Adult Education
Types:
CCSS:
6th Grade Ratios 4 - Plotting Ratios on the Coordinate Plane Powerpoint Lesson
Sixth Grade Ratios 4 - Plotting Ratios on the Coordinate Plane - This is perfect for distance learning on Zoom or similar formats. On top of that it is powerful when used as direct instruction in the classroom. It teaches students how to develop a table of equivalent ratios, write an equation from that information, and then plot the pairs on the coordinate plane. There are 22 effective teaching strategies based on research used in this lesson. For best results, students should have white b
Subjects:
Grades:
6th, Adult Education
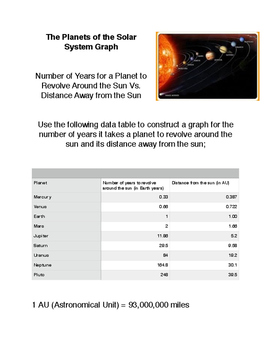
The Planets of the Solar System Graph
The Planets of the Solar System Graph is a graphing activity in which students will create a graph based on the distances of the planets in the solar system and the time it takes for each of the planets to revolve around the sun. Students will analyze the graph and draw a conclusion based on their evidence.
Subjects:
Grades:
5th - 12th, Higher Education, Adult Education
Types:
3rd Grade Graphs 5 - Line Plots Powerpoint Lesson
Third Grade Graphs 5 - Line Plots - This is perfect for distance learning on Zoom or similar formats. On top of that it is powerful when used as direct instruction in the classroom. It introduces the students to line plots. The following concepts are taught: grid, graph, coordinates, axes, scale, interval, title, and key. There are 22 strategies of effective teaching based on research in this powerpoint lesson. For best results, students should have white boards and dry erase markers. I
Subjects:
Grades:
3rd - 4th, Adult Education
Also included in: 3rd Grade Graphs Bundle - 6 Powerpoint Lessons - 277 Slides
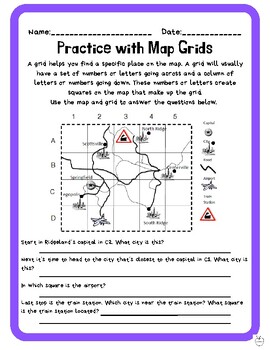
Map Grids and Coordinates
**Updated to include 2 more activities plus an answer key!!A comprehensive three-page resource designed to hone students' skills in reading maps, using coordinates, and navigating directions with confidence. This engaging activity enhances spatial awareness and map-reading proficiency.Engage in a hands-on learning adventure that not only reinforces essential map-reading skills but also encourages creativity. The resource includes an answer key for easy assessment. Elevate your geography lessons
Subjects:
Grades:
2nd - 6th, Adult Education
Types:
First Grade Common Core: Geometry Bundle
This is a 20 page bundle focused on the first grade common core standards for geometry. There are 6 activities that engage students by counting, drawing, and learning! Each day includes a standard sheet to hang on the board (that can be copied onto colored paper) with a daily objective. There is also a letter to be sent home at the beginning of each standard. Students will love these fun activities. Answer key is included!!
First Grade Common Core Complete Bundle ($8.50):
http://www.teacherspa
Subjects:
Grades:
K - 2nd, Adult Education
Types:
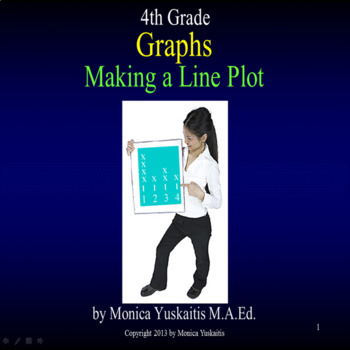
4th Grade Graphs - Making Line Plots Powerpoint Lesson
Fourth Grade Graphs - Making Line Plots - This is perfect for distance learning on Zoom or similar formats. On top of that it is powerful when used as direct instruction in the classroom. It teaches the students how to collect data and then make a line plot with that data. Students also review using a ruler to measure to the eighth of an inch and use this knowledge in making their line plot. There are 22 effective teaching strategies used in this lesson base on research. For best results,
Subjects:
Grades:
4th, Adult Education
CCSS:
Showing 1-24 of 194 results


