TPT
Total:
$0.00

Graphing Bundle

;
Fudge Factors
66 Followers
Grade Levels
7th - 10th, Homeschool
Resource Type
Standards
Formats Included
  • Zip
$10.80
List Price:
$13.50
You Save:
$2.70
Bundle
$10.80
List Price:
$13.50
You Save:
$2.70
Bundle
Share this resource
Report this resource to TPT
Fudge Factors
66 Followers
Easel Activities Included
Some resources in this bundle include ready-to-use interactive activities that students can complete on any device.  Easel by TPT is free to use! Learn more.

Products in this Bundle (7)

    showing 1-5 of 7 products

    Also included in
    1. Whatever I have in my other bundles is in this one giant bundle. This way there are no overlaps ("graphing" can overlap with "lab", which can overlap with each of the physics sub-topics of "kinematics", "forces", "momentum and impulse", and "Work-Energy"). Most resources have keys attached.I am in t
      Price $68.40Original Price $85.50Save $17.10

    Description

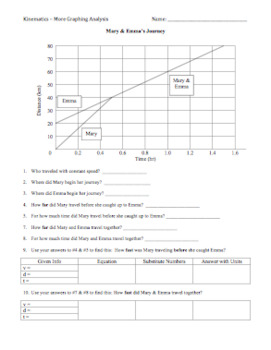
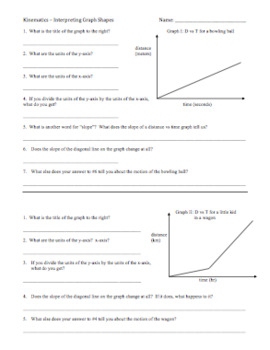
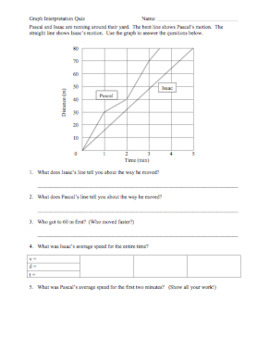
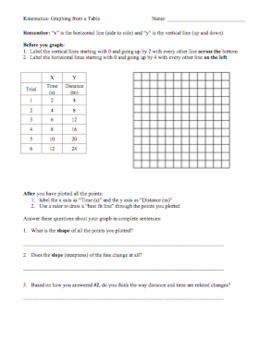
    This bundle includes all of my graphing activities and problem sets. The focus of each of these activities is two-fold:

    1) Plotting points correctly

    2) Understanding the meaning

    Most of these activities are paper-and-pencil only. "Graphing Real World Data" starts with a hands-on class activity of timing a bowling ball's roll across the room to show students a concrete example of an object moving and then constructing a graph from the motion to teach the students that a line diagonally upward on the page is an object moving away from a chosen origin and NOT an object moving up a hill (many of my younger students have this misconception) So, for "Graphing Real World Data", you will need to obtain a hill, ball, meterstick, tape, and stop watches.

    I use most of these with all of my general science and physics classes. However, "Interpreting velocity vs time graphs" is really only for my upper-level classes.

    Total Pages
    Answer Key
    N/A
    Teaching Duration
    N/A
    Report this resource to TPT
    Reported resources will be reviewed by our team. Report this resource to let us know if this resource violates TPT’s content guidelines.

    Standards

    to see state-specific standards (only available in the US).
    Graph proportional relationships, interpreting the unit rate as the slope of the graph. Compare two different proportional relationships represented in different ways. For example, compare a distance-time graph to a distance-time equation to determine which of two moving objects has greater speed.
    Use similar triangles to explain why the slope m is the same between any two distinct points on a non-vertical line in the coordinate plane; derive the equation 𝘺 = 𝘮𝘹 for a line through the origin and the equation 𝘺 = 𝘮𝘹 + 𝘣 for a line intercepting the vertical axis at 𝘣.
    Understand that the graph of an equation in two variables is the set of all its solutions plotted in the coordinate plane, often forming a curve (which could be a line).
    Explain why the 𝘹-coordinates of the points where the graphs of the equations 𝘺 = 𝘧(𝘹) and 𝘺 = 𝑔(𝘹) intersect are the solutions of the equation 𝘧(𝘹) = 𝑔(𝘹); find the solutions approximately, e.g., using technology to graph the functions, make tables of values, or find successive approximations. Include cases where 𝘧(𝘹) and/or 𝑔(𝘹) are linear, polynomial, rational, absolute value, exponential, and logarithmic functions.

    Reviews

    Questions & Answers

    66 Followers