672 results
2nd grade graphing handouts
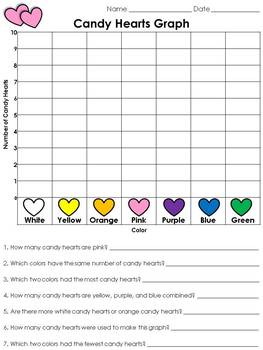
Valentine's Day Candy Hearts Graph with Questions - Interpret Data - King Virtue
Valentine's Day Candy Hearts Graph - Interpret Data - King Virtue
Incorporate Valentine's Day in your classroom with this Valentine's Day Candy Hearts Graph. Students will love sorting, counting, and graphing the candy hearts. Afterwards, students interpret their graphs by answering the questions.
This set includes:
1 graph
1 graph (black and white)
Enjoy!
:)
Subjects:
Grades:
2nd - 4th
Types:
Also included in: Math MegaBundle - King Virtue's Classroom
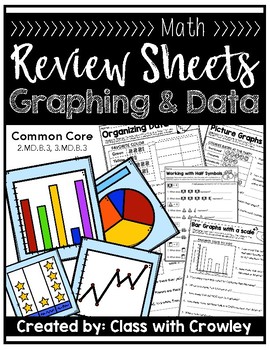
Graphing and Data (Review Sheets)
Easy... no prep... 37 Different review sheets to practice reading and interpreting graphing and data. Collecting data of your ownLabeling different tables, graphs and chartsFrequency Tables•Organizing data from a tally chart into a frequency table•Using a frequency table to answer one step questions•Using a frequency table to answer multi-step questions•Reading and interpreting multi-column frequency tablesPicture Graphs•Reading a picture graph w/no scale•Reading a picture graph w/ a scale•Using
Grades:
2nd - 4th
Types:
2012/2016 Go Math! Chapter 10 Second Grade Supplemental Resources-Common Core
UPDATE: Temporary Exit Tickets have been added! Check back soon for a full packet update ! This packet is meant to supplement Go Math! Chapter 10 Second Grade. I have included labels to keep you organized by Lesson numbers. -COMMON COREIncluded are Problem of the Day Glue in Journal Strips I Can Statements Vocabulary Cards Worksheets Center Games/Group Activities
Subjects:
Grades:
2nd
Types:
CCSS:
Also included in: 2012/2016 Edition GO Math Second Grade Common Core BUNDLE!
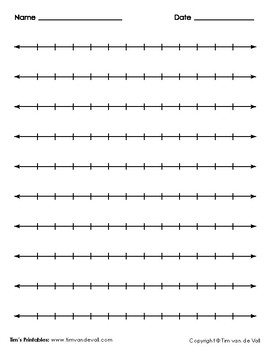
Blank Number Line Template
A simple number line template, containing 10 blank number lines. Useful for teaching numbers, decimals, and graphing. Pdf format.
Grades:
PreK - 7th
Types:
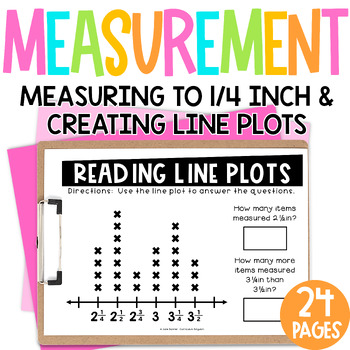
Line Plots with Fractions and Measuring to the Quarter Inch Worksheets 3.MD.4
These 3rd grade measurement activities give students practice measuring to the nearest half inch, measuring to the quarter inch, making a line plot from measurement data and answering questions based on measurement data. There are 24 full-page worksheets, 24 quarter page sheets (great for exit tickets) and 24 answer pages. What's included:- 6 pages for measuring to the nearest half inch- 6 pages for measuring to the nearest quarter inch- 6 pages for making a line plot from measurement data- 6 pa
Subjects:
Grades:
2nd - 4th
Types:
CCSS:
Also included in: 3rd Grade Math Worksheets and Exit Tickets FULL YEAR Bundle
Go Math! 3rd grade Chapter 2 Resource Kit for USING DATA!
In this packet you will find Vocabulary Cards, Pretests, and Journal entries per section for Chapter 2 in the GO Math! Series for 3rd Grade.
In this Grade 3 Go Math! Chapter 2 Resource Kit you will find:
* A genuine resource kit to help your students represent and interpret data
* Everything is aligned to common core standards
* Vocabulary cards to use on bulletin boards or a focus wall
* A pretest WITH KEY to assess students before beginning the chapter. It could also be used to assess studen
Subjects:
Grades:
2nd - 3rd
Types:
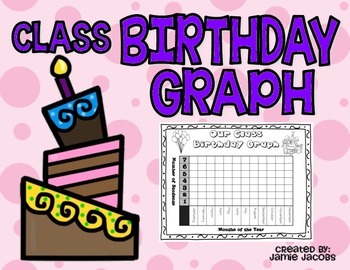
Class Birthday Graph
Use this Birthday Graph as a fun math class activity to record all your student's birth months. After completing the bar graph as a class you then can ask questions to the students about the graph.
For personal classroom use only. This work is licensed under a Creative Commons Attribution-NonCommercial-NoDerivatives 4.0 International License.This license is the most restrictive of our six main licenses, only allowing others to download your works and share them with others as long as they cred
Grades:
K - 5th
Types:
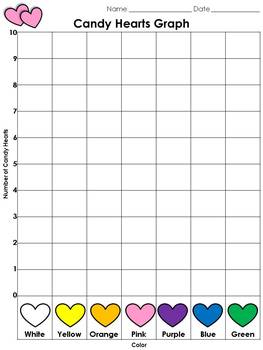
Valentine's Day Candy Hearts Graph - Full Page - King Virtue
Valentine's Day Candy Hearts Graph - Full Page - King Virtue
Incorporate Valentine's Day in your classroom with this Valentine's Day Candy Hearts Graph. Students will love sorting, counting, and graphing the candy hearts. Afterwards, you can help students interpret their graphs by asking them questions about them.
This set includes:
1 graph
1 graph (black and white)
Enjoy!
:)
Subjects:
Grades:
PreK - 3rd
Types:
Also included in: Math MegaBundle - King Virtue's Classroom
Green Eggs and Ham Taste Test Graphing
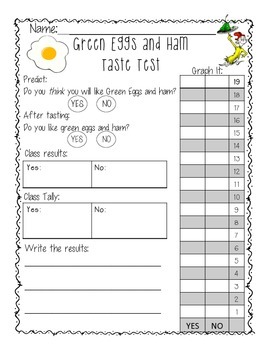
During your thematic unit of study of Dr. Seuss, use this simple graphic organizer for the story Green Eggs and Ham.Before the students eat the green eggs and ham, complete the first question of predicting if they'll like green eggs and ham.After tasting them, each child should write their name on an egg (provided in the download) and place on the class graph.When each child casts their vote, complete the worksheet with the necessary data.
Subjects:
Grades:
PreK - 2nd
Types:
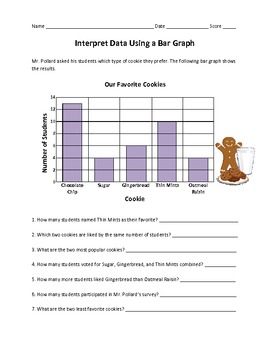
Bar Graphs - Interpret Data, Create Questions and Graphs - King Virtue
Bar Graphs - Interpret Data, Create Questions and Graphs - King Virtue
On these activities, the students will:
Interpret data using bar graphs
Create questions based on a bar graph
Create bar graphs using data collected
Answer key included
Subjects:
Grades:
2nd - 4th
Types:
Also included in: Math MegaBundle - King Virtue's Classroom
Blank Editable Graphs
These are blank graphs that you can edit by typing in the name of the graph and whatever objects are being graphed. There are bar graphs, a pie graph, and a line graph template.
Subjects:
Grades:
K - 3rd
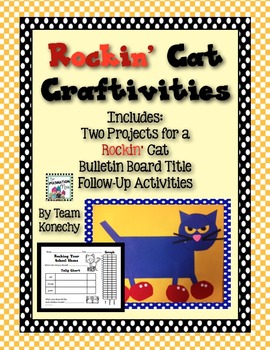
Rockin' Cat Craftivity
Let's start your year off with a two fun craftivities and a great bulletin board the kids will be sure to love. These follow up activities go along with the craftivities and the much loved groovy cat stories. It can be done with a range of levels. Graphing, writing, and crafts...Oh MY!
Surprise Craftivity included of a much loved storybook character.
©TeamKonechy2014
Grades:
K - 2nd
Types:
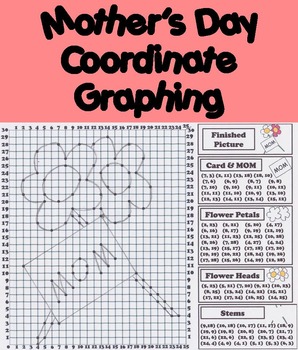
Happy Mother's Day Activity: Coordinate Plane Graphing Picture/ Ordered Pairs
Mother's Day: This Mother's Day activity has students graphing a special present for their Mother.
Mother's Day graphing activity is also a great way to seamlessly incorporate Mother's Day with math!
Important: Check out my Coordinate Graphing Activities:
♦ Graphing the Constellations:
♦ Easter Bunny (Spring) Coordinate Graphing
===========================================================================
Customer Tips: How to get TPT credit to use on future purchases:
Subjects:
Grades:
2nd - 8th
Types:
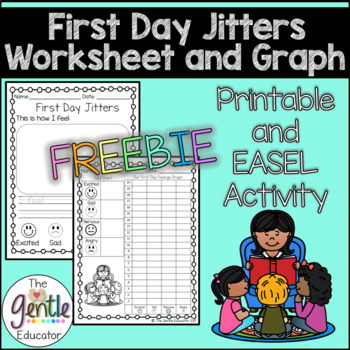
First Day Jitters Worksheet and Graph - Printable and EASEL Activity
These are two worksheets that can be used on the first day of school to use to supplement the book, First Day Jitters by Julie Danneberg.The first worksheet allows the students to select how they are feeling out of the four choices. The visuals above the words supports ELLs and students with special needs. After the students circle their feeling, they will complete the sentence starter by writing the word how they feel on the dotted line. After students complete their sentence, they will illustr
Subjects:
Grades:
PreK - 2nd
Types:
Pictograph Template, Data and Graphing Picture Graph Template, Word File (.docx)
Enhance your elementary data and graphing unit with an editable pictograph template. I've created this picture graph template as a table within a Microsoft Word document (.docx) so that you can easily adapt it to suit your needs. PDF and jpg versions are also included.
Common Core Math Standards:
3.MD.B.3 - Draw a scaled picture graph and a scaled bar graph to represent a data set with several categories.
2.MD.D.10 - Draw a picture graph and a bar graph (with single-unit scale) to represent a
Subjects:
Grades:
PreK - 5th
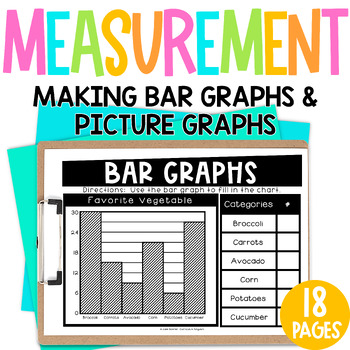
3rd Grade Math Graphing Worksheets Bar Graphs Pictographs 3.MD.3
These graphing worksheets give 3rd graders practice reading and making scaled bar graphs and picture graphs. There are 18 worksheets and 18 answer pages. Each page also comes in 1/4 size so that you can easily use them as exit tickets.What's included:- 3 worksheets for reading horizontal bar graphs- 3 worksheets for reading vertical bar graphs- 3 worksheets for making horizontal bar graphs- 3 worksheets for making vertical bar graphs- 3 worksheets for reading picture graphs- 3 worksheets for mak
Subjects:
Grades:
2nd - 4th
Types:
CCSS:
Also included in: 3rd Grade Math Worksheets and Exit Tickets FULL YEAR Bundle
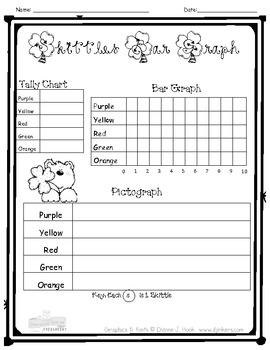
Graphing Skittle Math Activity
A fun and interactive way to teach graphing skills with the use of Skittles. Let kids "taste the rainbow" as they learn how to use tally marks, pictographs, and bar graphs. Great activity to do in March around St. Patricks day!
Grades:
1st - 3rd
Types:
Identifying Parts of a Graph Worksheets
These worksheets are the perfect way to introduce, or reinforce, the different parts of a graph with your students! 2 different worksheets have students label the title, labels, and data on bar graphs. Each worksheet also contains questions that require students to examine and analyze the data from the graphs. No prep - just print and go! Answer keys included!
Grades:
2nd - 4th
Types:
Also included in: Graphing Worksheets Bundle
Notre Classe - Diagrammes à bandes
This is a data management package, containing black line masters for a title page and 11 different bar graphs for you and your class to complete.You can choose to:complete them all as a class, and create one "class book" to take home on a rotating basishave each student complete some or all of the pages by surveying classmateshave each student create a booklet about their class as a take-home read aloud, practicing math vocabulary and sight wordscomplete the data using tally marks as a class and
Subjects:
Grades:
K - 2nd
Types:
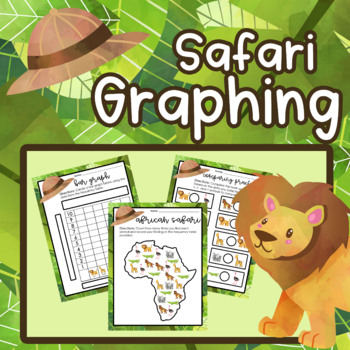
African Safari Graphing- Bar Graph, Line Graph, Pictograph, Frequency Table
Make math fun with African Safari Graphing!Students create a frequency chart, bar graph, pictograph/picture graph, and line plot based on data. Students can cut out and create dice, or save on time and use pre-made data!Students then solve problems and answer questions based on their data, as well as an added sheet for older students to find mean, median, mode, range, and outliers.Includes bonus multiplication and comparing numbers practice.Perfect for safari, jungle, zoo, and animal themed acti
Subjects:
Grades:
2nd - 5th
Types:
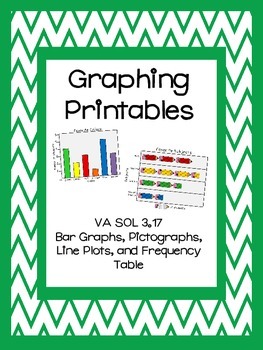
Graphing No Prep Printables - Interpret Data, Create Graphs, Write Questions
These no-prep printables are a great addition to your graphing unit or as a review for test prep.
The following graphs are included: Vertical bar graph, Horizontal Bar Graph, Pictograph, Line Plot and Frequency Table.
The 4 graphs are easy to read and include 6 questions for students to answer. The frequency table is provided for students to create their own bar graph.
These printables are aligned with VA SOL 3.17, but can be used in any classroom!
*****************************************
Subjects:
Grades:
2nd - 5th
Types:

Health - Screen Time
This resource is filled with worksheets that will help you cover the Ontario curriculum expectations within grade 1 for Substance Use, Addictions, and Related Behaviours. Students will be introduced to devices with screens, reflect on how often they use devices within a day, and come to understand the signs of being hooked on these devices (an example being video games). This is a huge upgrade from my free screen time resource with a lot more material - complete.There is graphing, using Venn d
Subjects:
Grades:
K - 3rd
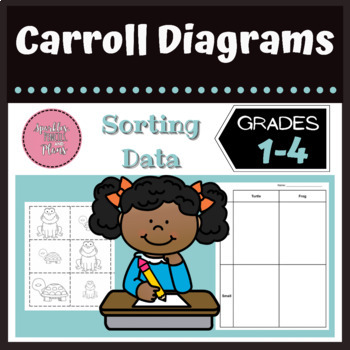
Carroll Diagrams
These Carroll Diagrams help your students learn to sort data into various categories. Use with data management and in addition to sorting with Venn Diagrams.Four versions includedFollow me on Instagram, Facebook, Pinterest, and follow my store on TPT! Thanks for purchasing! Don’t forget to leave feedback! When you leave feedback, you earn TPT credits toward future purchases!
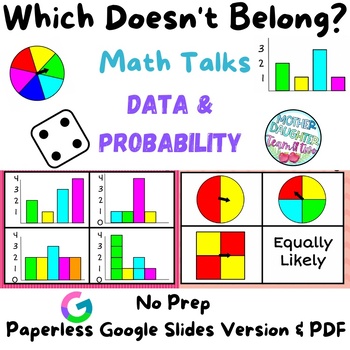
Which Doesn't Belong - Data, Graphing, Probability - Math Talks & Centers
***** NOW INCLUDES GOOGLE SLIDES FORMAT as well as PDF*****No Prep! Great for in person learning and digital classes!More than 30 activities provided in 2 different formats: one for group discussions, one for individual use or math centres. Including:Data analysis (bar graphs, pictographs, tally charts)Probability (likelihood, spinners, dice)Sorting (Ven Diagrams)American spelling and Canadian/UK/AU spelling included!Don't underestimate the value of students learning from each other! These "Whic
Showing 1-24 of 672 results


