24 results
Adult education graphing lectures
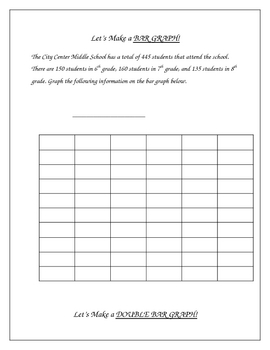
Constructing Graphs - Bar Graphs, Line Graphs, Circle Graphs
**I revised the numbers in the pie graph on this from the first version, these amounts are much more friendly** This activity includes construction of a bar graph, double bar graph, line graph, double line graph, and a circle graph.I put this together after being frustrated about not being able to find any graphing activities appropriate for intermediate grades that would allow me to make graphs with the class on my smartboard. I needed some examples to demonstrate how to take data and create a
Subjects:
Grades:
3rd - 10th, Adult Education
Types:
Histograms and Frequency Tables (Powerpoint) for Busy Teachers
This powerpoint presentation introduces the concept of histograms and frequency tables.
Clipart, sounds, and animation are used sparingly and effectively to help illustrate points without being distracting. This powerpoint presentation has been extensively refined using faculty AND student input and feedback.
Definitions of histogram, interval, frequency table, and frequency are all presented. The progression from a frequency table to a completed histogram is illustrated and animated using
Subjects:
Grades:
4th - 12th, Higher Education, Adult Education
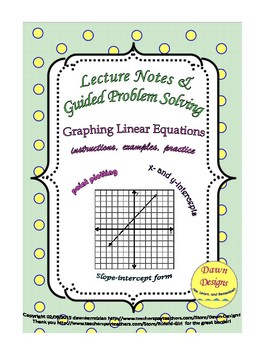
Graphing Linear Equations - Lecture: Plot Points, X- and Y-Intercepts, Slope
Instructions, examples, and practice problems are provided for each graphing method, along with charts and rectangular (Cartesian) coordinate grids, to guide the students through calculating points and then plotting them on the graph. It is beneficial to have the students follow along and fill in the worksheets during lecture, but the worksheets can also be worked on in groups or independently. Three methods for graphing lines are presented:Point PlottingX- and Y-InterceptsSlope-InterceptSolut
Subjects:
Grades:
7th - 11th, Higher Education, Adult Education
Types:
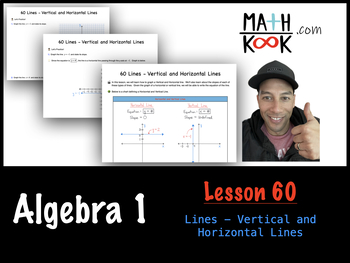
Algebra 1 - Lines - Vertical and Horizontal Lines (60)
This is 60 of ~134 Algebra 1 Lectures available. Each Lesson consists of the following 3 items. Bundle Available for all ~134 Lessons too... and much cheaper to purchase them all.1) Lecture Notes w/Examples2) Worksheet to practice3) KEY for Worksheet with full solutions, step-by-stepWhat does Lesson 60 cover? In this lesson, we will learn how to graph a Vertical and Horizontal line. We’ll also learn about the slopes of each of these types of lines. Given the graph of a horizontal or ve
Grades:
7th - 9th, Adult Education
Types:
Also included in: Algebra 1 - Linear Equations - BUNDLE!!
Algebra Power Point: Graphing Inequalities in Two Variables with GUIDED NOTES
With the greatest of enthusiasm, I share my most recent power point with you on "Graphing Inequalities in Two Variables".
* The lesson begins with a review showing ordered pairs as solutions to inequalities.
* Step by step, students move into graphing inequalities of vertical and horizontal lines.
* They review the meaning of boundaries, half-planes, and how to test for the solution half-plane.
* Progressing, they graph inequalities in two variables using slope-intercept
Subjects:
Grades:
7th - 12th, Higher Education, Adult Education
CCSS:
BUNDLE: Algebra PP Solving and Graphing Linear Inequalities/DISTANCE LEARNING
I am delighted to present my BUNDLE of power points covering all required material on "Solving and Graphing Linear Inequalities." * The complete bundle is 290 pages and the $31.50value has been reduced to $26.75, a savings of nearly 16%! * The lessons include the following topics: Solving Inequalities Using Addition and Subtraction, Solving Inequalities Using Multiplication or Division, Solving Multi-Step Inequalities, Solving Compound Inequalities Involving "AND", Solving Compound
Subjects:
Grades:
7th - 11th, Higher Education, Adult Education
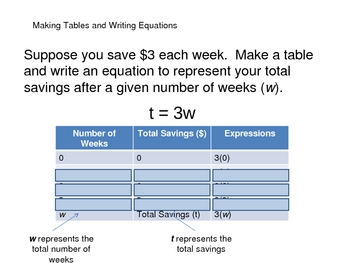
Equations, Tables, and Graphs
This powerpoint shows students how to graph a linear equation (pre Algebra - not understanding slope and y-intercept yet) with x & y tables. The powerpoint takes the outcome of the x/y tables, puts them into ordered pairs (x,y)and graphs the points and lines on a coordinate plane. I have used this lesson with both an interwrite pad and samrtboard.
Introduction to Data Visualization
This presentation introduces key concepts and considerations in data visualization, including:the history of data visualizationan introduction to the benefits and importance of data visualization types of visualizationshow to choose a visualization typedata visualization design principles and best practicesleading data visualization platforms the differences between raster and vector graphicskey considerations when thinking about creating a visualization Use this as part of a unit on graphing, d
Subjects:
Grades:
6th - 12th, Higher Education, Adult Education, Staff
Also included in: Graphic Design Growing Bundle
GRAPH PAPER NOTEBOOK
GRAPH PAPER NOTEBOOK 2022This paper book is a 102-page graph paper notebook consisting of pretty little square sheets in plain light blue, paper size 8.5 x 11 inches, 21.59 x 27.94 cm.★ ★This paperbook has several characteristics, including:· Plenty of space for writing or drawing· Font color is light blue· The size of the book is medium and suitable for different users and in different fields.· Pptx file containing lines and frame with transparent backgrounds that can be modified· JPG size 8.5
Subjects:
Grades:
7th - 12th, Higher Education, Adult Education, Staff
Introduction to Data Visualization - Google Slides Presentation
This fully editable Google Slides presentation introduces key concepts and considerations in data visualization, including:the history of data visualizationan introduction to the benefits and importance of data visualizationtypes of visualizationshow to choose a visualization typedata visualization design principles and best practicesleading data visualization platformsthe differences between raster and vector graphicskey considerations when thinking about creating a visualizationUse this as par
Subjects:
Grades:
6th - 12th, Higher Education, Adult Education
Also included in: Graphic Design Growing Bundle
Algebra Power-Point: Solving Absolute Value Equations/DISTANCE LEARNING/NO PREP
I am so delighted to share this power-point over Absolute-Value Equations.
* Students are introduced to a familiar concept (absolute value), but in the following lesson, it is applied to solving algebraic equations.
* Students will solve basic absolute-value equations.
* They will progress to solve more difficult absolute-value equations.
* Ultimately, they will write their own absolute-equations, given two solutions.
* A short four-question "follow-up assessment
Grades:
7th - 10th, Higher Education, Adult Education

Why Do I have to Learn Algebra?
A teacher’s nightmare question “Why do I have to Learn Algebra”. Want to finally answer this question? This set of activities will hopefully try to answer this question for you. Here are some of the reasons that you may present to your students: Learning algebra helps to develop your critical thinking skills. That includes problem solving, logic, patterns, and reasoning. You need to know algebra for many professions, especially those in science and math. Algebra is everywhere in our
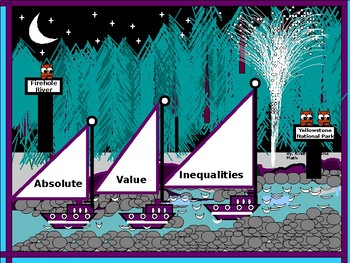
Algebra Power-Point: Absolute-Value Inequalities/DISTANCE LEARNING/NO PREP
It is with great pleasure that I share my 34 slide power point lesson on Absolute-Value Inequalities.
* Students learn about how to solve absolute-value inequalities.
* They learn to solve more challenging absolute-value inequalities (including multi-step absolute-value inequalities)
* They then apply what they have learned to real life problems involving "Old Faithful" in Yellowstone National Park.
* The lesson is aligned with CC expectations and Across the Curriculu
Grades:
7th - 11th, Higher Education, Adult Education
Algebra PP:Solving Inequalities Using Multiplication or Division/NO PREP
Today's lesson covers Solving Inequalities Using Multiplication or Division
* One will find that the lesson is in step with common core standards.
^ The lesson includes instructions on the Properties of Inequalities relative to multiplication and division where students solve inequalities and then graph the solutions on a number line.
* Each slide offers the student a clear picture-representation of where the solutions are in the set of Real Numbers.
* Students learn the
Subjects:
Grades:
6th - 10th, Higher Education, Adult Education
CCSS:
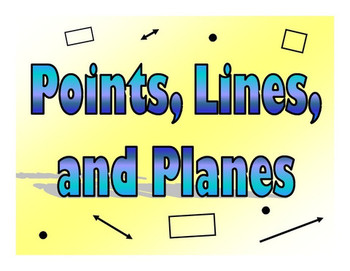
Lines, points and Planes
This is a 15 slides Power Point presentation that covers Points, Lines and Planes. It contains the definitions of points, lines and planes with good examples.
My Quizzes:
4th Grade Word Problems Quiz (10 Q)
Equations and Inequalities Quiz (20 Questions)
An Introduction to Functions Quiz (11 Questions)
Evaluate Expressions Quiz (22 questions)
Pairs of Lines Quiz (17Q)
Types of Angles Quiz (10 Q)
Increasing Growth Pattern Quiz (10 Q)
Compare and Order Decimals Quiz (10 Q)
Ratio Q
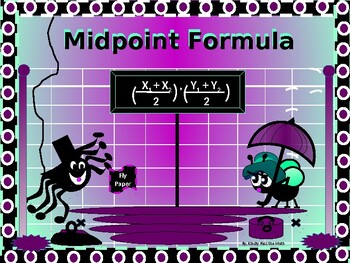
Algebra: Finding the Midpoint with GUIDED NOTES & DISTANCE LEARNING NO-PREP
I could not be more enthused than I am in sharing my "Midpoint" power point with GUIDED NOTES! * The lesson begins with a clear definition of what a midpoint is and how it compares to other concepts previously learned by the students.* Progressing, the midpoint formula is presented and explained. * After using the formula to calculate the midpoint between two endpoints of a line segment, students are instructed to plot the endpoints and the midpoint on a coordinate plane. * Finally, stud
Grades:
7th - 12th, Higher Education, Adult Education
CCSS:
TRIGONOMETRY: THE TRANSFORMATION OF SINE & COSINE FUNCTIONS
To transform a graph of a function means to shift its graph to the left or right hand side, stretch/shrink vertically or horizontally, or to reflect its graph across the x-axis or the y-axis. In this document, the students will learn about what it means to transform sine and cosine functions. Illustrated examples are also given.
Subjects:
Grades:
10th - 12th, Higher Education, Adult Education, Staff
Types:

Demand, Supply, & Elasticity
Here's a file that includes lectures on Demand, Supply, and Elasticity. There are notes for each powerpoint, as well as a worksheet on demand of elasticity. Content covered includes how to graph them, the determinants of supply & demand, and supply & demand of elasticity.
Grades:
10th - 12th, Higher Education, Adult Education
Also included in: Economics Lessons Bundle
The Graphs of Trigonometric functions
In this e-book, the graphs of sine, cosine, tangent, cosecant, secant and cotangent functions are given and discussed.
In particular, we discuss:
1. The domain
2. The range
3. The period
4. The x-intercept(s)
5. The y-intercept
6. The vertical asymptote
Subjects:
Grades:
9th - 12th, Higher Education, Adult Education, Staff
Types:
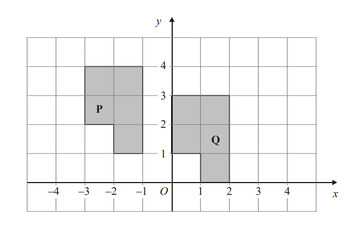
Midpoint of a Line, Translation and Reflection of 2D Shapes. PPT File
This is a power point presentation that covers the topic midpoint of a line segment, the coordinate of a point that lies a fraction of a line segment. Translation of 2D shapes with examples that cover performing the translation and describing the translation.Reflection of 2D shapes with examples that cover performing the reflection and describing the reflection.
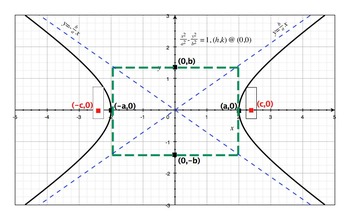
Hyperbolas I
Concise hand-out and podcast for those classes just beginning to graph hyperbolas or for those students who may need a review. Clear definitions and graphs.Great for math classes of any age group, math centers, or tutoring centers.

Properties of Exponential Graphs Slides
Can be used for math 3 or pre-calculus. There is a story, some discovery based learning and examples.How to find end behavior, shape, y-intercept and graph transformations for exponentials.I used these for distance learning and voice recorded over them as a lesson. You can view the video here: https://youtu.be/NeNx0QmvH1o
Subjects:
Grades:
9th - 12th, Higher Education, Adult Education
Graphing Inequalities on the Number Line
Graphing one variable inequalities using a number line
Subjects:
Grades:
4th - 12th, Higher Education, Adult Education
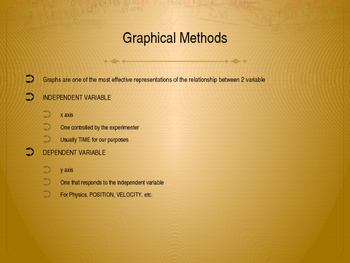
Graphing Models
Basic Introduction to Graphing Models
Subjects:
Grades:
10th - 12th, Higher Education, Adult Education
Showing 1-24 of 24 results


