335 results
Adult education graphing worksheets
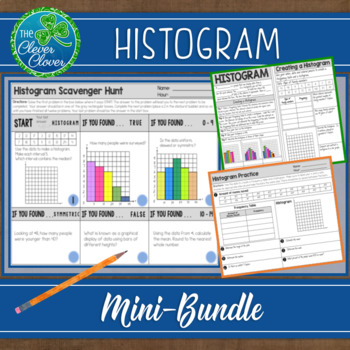
Histogram - Notes, Practice Worksheets and Scavenger Hunt
This histogram resource includes guided notes, a practice worksheet and a scavenger hunt. Your students will have the opportunity to create, interpret and discuss histograms. Below, you will find a detailed description of the notes, worksheet and scavenger hunt. Guided NotesThere are two small pages of guided notes. The first page provides the definition of a histogram and step by step instructions on how to create a histogram. The bottom portion of the notes has students examine three types (un
Subjects:
Grades:
6th - 9th, Adult Education
CCSS:
Also included in: Statistics Bundle - Guided Notes, Worksheets & Scavenger Hunts!
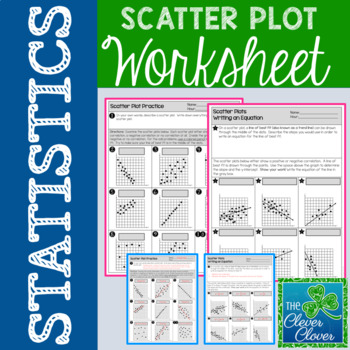
Scatter Plot Worksheet
Scatter Plot Worksheet
This resource allows students to explore scatterplots with a two page worksheet. Students are asked to define scatterplots in their own words. Nine questions ask students to identify the type of correlation (positive, negative or no correlation) that exists between two variables. Students are also asked to describe the steps used to write an equation for the line of best fit. Six additional questions require students to calculate the slope and determine the y-intercept
Subjects:
Grades:
6th - 9th, Adult Education
Types:
CCSS:
Also included in: Scatter Plot Mini-Bundle
Line of Best Fit/Trend Line/Scatter plot Notes & Practice (facebook)
This is scatter plot activity that has notes on line of best fit/trend line. Students are encouraged to create scatter plots from data from baseball games, as well as amount spent on facebook vs. time doing homework. This is a great real-life activity! It is very fun and engaging. After each scatter plot, questions are asked to determine knowledge from interpreting the scatter plots, as well as the line of best fit! Answer key is included.
Grades:
6th - 10th, Adult Education
Types:
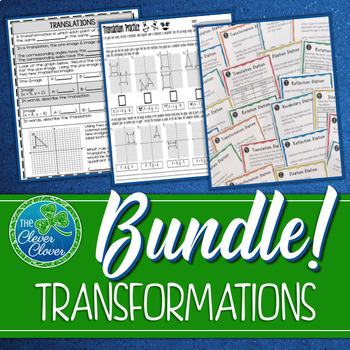
Transformations (Translations, Dilations, Rotations and Reflections) Bundle
The bundle will help you immensely with 8th grade transformations. Students will learn and explore translations, dilations, rotations and reflections. Included you will find interactive notes, worksheets, stations, a sorting activity and assessments. Below, you will find a detailed description of everything included in this bundle.Interactive Notes (4 pages & Answer Keys)This product involves four pages of interactive notes on translations, dilations, rotations and reflections. Each note
Grades:
7th - 9th, Adult Education
CCSS:
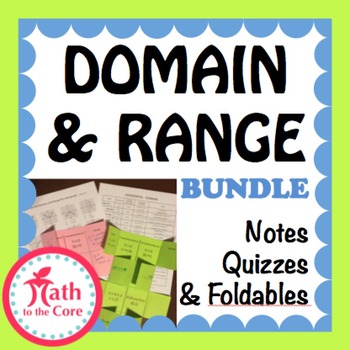
Domain and Range of a Graph Bundle
Domain and Range of a Graph Notes, Homework, and Quiz Bundle
with inequality, interval, and set builder notation
This will stop all confusion of Domain and Range Notation!!!
My students find the chart invaluable especially the Vertical Graph depictions.
Included in this package
1. Complete Chart for Domain and Range Notation
2. Complete Chart for Domain Notation
3. Complete Chart for Range Notation
4. Foldable Template
5. Quiz 1 (easy) version A
6. Quiz 1 Key
7. Quiz 2 (easy) version
Grades:
7th - 12th, Higher Education, Adult Education
Types:
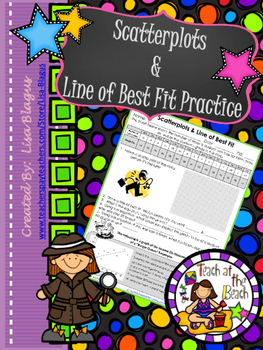
Scatter Plot & Line of Best Fit/Trend Line Mini-Practice
This is a mini lesson on scatter plots. It starts with a giving the students a table and having them graph the data onto a scatter plot. They then find the trend line or the line of best fit and have to answer questions. This is a wonderful homework assignment with not too many questions. It also could serve as a station or in-class assignment.
Grades:
7th - 10th, Adult Education
Types:
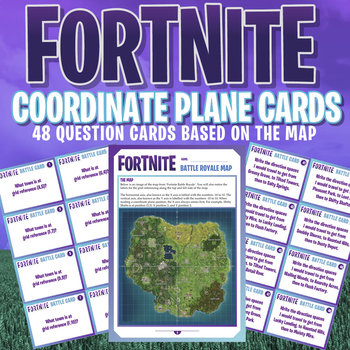
FORTNITE - MATHS - COORDINATE PLANE ACTIVITY CARDS - 48 Question Cards!
SEE OUR EXCITING NEW FORTNITE WORD PUZZLES HERE!HIGH INTEREST - HIGH ENGAGEMENTAn incredible set of 48 question cards, based on the wonderful Fortnite Battle Royale map. Map sheet included!Questions range from the basic naming place at certain coordinate plane reference, right through to the higher level, label the coordinate references of path taken along a designated journey!Great fun for the entire class, and for students of all levels!Check out also the HIGH RESOLUTION MAP PACK available fro
Subjects:
Grades:
4th - 10th, Higher Education, Adult Education, Staff
Types:
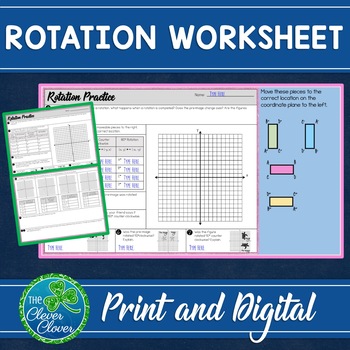
Transformations - Rotation Worksheets - Print and Digital - Google Slides
This NO PREP resource can be used to strengthen your students understanding on Rotations. Included you will find print and digital graphic organizers and writing exercises. This resource can be used with a Google Classroom, distance learning and homeschooling.This product provides practice with rotations. Students will have an opportunity to define rotations in their own words. They are guided to explain what happens when a rotation is completed and to explain whether or not the images are cong
Grades:
7th - 9th, Adult Education
Types:
Also included in: Transformation Worksheets Mini - Bundle
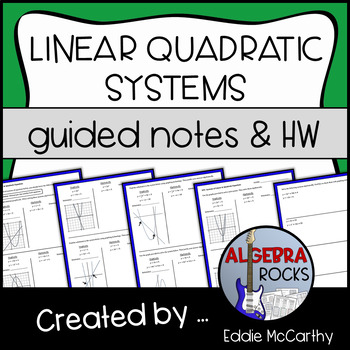
Linear Quadratic Systems of Equations Guided Notes and Homework
This lesson is part of my Quadratic Functions UnitThis lesson includes 3 pages of guided notes and a 2 page assignment.Students learn about linear quadratic systems in the order below. They will:- Recall what it means to be a “solution” to a system- Solve 3 systems using provided graphs, then algebraically (GCF factoring, trinomial a=1, GCF trinomial a=1)- Solve 2 systems using graphing technology, then algebraically (trinomial a>1, quadratic formula)- Solve a final system using a provided gr
Subjects:
Grades:
7th - 12th, Adult Education
CCSS:
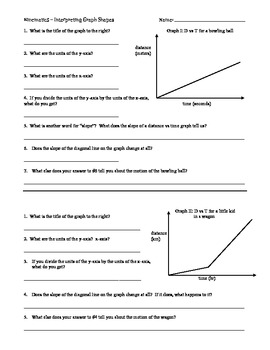
Graphing - Interpreting Distance vs Time Graphs
This worksheet gives students 4 distance vs time graphs and a series of questions about each to lead them through reading graphs. The main goal is to hammer home the point that slope = velocity.This is the second in my set of worksheets on graphing that will lead students through the basics of constructing graphs, interpreting the meaning of graphs, and calculating quantities from graphs.This is ideal for physical science classes where the students are in pre-algebra or algebra 1.
Subjects:
Grades:
7th - 9th, Adult Education
Types:
Also included in: Graphing Bundle
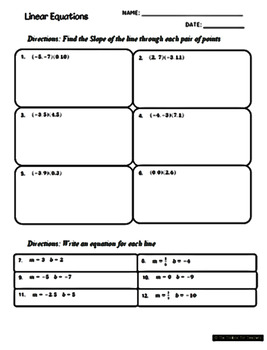
Linear Equations Quiz Review Slope Graphing Slope Intercept Skills Homework
Linear Equations Quiz Review Slope Graphing Slope Intercept Skills HomeworkThis PDF Worksheet contains 18 problems and the Answer Key.(6) problems: Calculating Slope(6) problems: Writing equations when given the “m” and “b”(4) problems: Write each equation in Slope Intercept Form. Then identify the slope & the y-intercept.(2) problems: Graphing Slope Intercept FormI appreciate your feedback and product ratings. Let’s connectThe Toolbox for Teachers on PinterestThe Toolbox for Teachers on Fac
Subjects:
Grades:
8th - 12th, Adult Education
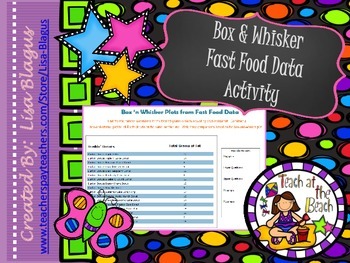
Box 'n Whisker Data for Local Fast Food Restaurants
This activity brings a real-life activity into the classroom. Students look at 4 popular fast food restaurants (Arbys, KFC, Dunkin Donuts, and Pizza Hut)and find the median, maximum, minimun, lower quartile, and upper quartile from their grams of fat. After looking at each of them, students are asked to answer questions pertaining to the box and whisker graphs they've drawn from the data. A fun way to construct graphs and look at data!!!
Looking for a few more resources? This product is par
Subjects:
Grades:
6th - 11th, Adult Education
Types:

ACT Math Test Prep for Algebra Geometry Number Sense
This ACT math resource has 26 questions covering the following topics: functions, algebraic and geometric transformations, graphing, exponent rules, slope, midpoint, quadratic formula, geometric sequences and more! The answer key comes with explanations for each problem! Standards are included so student can determine weaknesses. If you want a combination of SAT, PSAT, ACT and ACCUPLACER and TSI, then check out the Mega Bundle below:COLLEGE TEST PREP MEGA BUNDLE - 3 BUNDLES IN ONE!Copyright © Ti
Grades:
9th - 12th, Higher Education, Adult Education
Types:
Also included in: ACT Math Test Prep Bundle
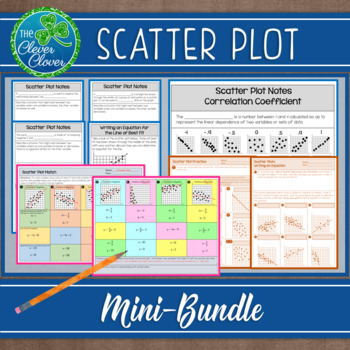
Scatter Plot Mini-Bundle
This resource includes six half pages of notes that are perfect for interactive notebooks. The first three pages introduce students to positive, negative and no correlation scatter plots. Students are asked to describe real world situations that might exist for each type of correlation. Students will graph three different sets of data in order to visualize the different types of scatterplots. Definitions for the line of best fit and correlation coefficient are provided. Each one of the half p
Subjects:
Grades:
6th - 9th, Adult Education
CCSS:
Valentine Day Graph
Valentine Day graph and symmetry activity for coordinate plane
Not only do students need to know how to graph line segments they will use their symmetry skills to complete the Valentine Day heart.
This file contains 8 pages.
Heart Graph in Quadrant I in color
Heart Graph in Quadrant I with black and white graphics
Heart Graph in Quadrant I with outline graphics
Heart Graph in Quadrant I Key
Heart Graph in Quadrant I, II, III, and IV in color
Heart Graph in Quadrant I, II, III, and IV with b
Subjects:
Grades:
5th - 12th, Higher Education, Adult Education
Types:
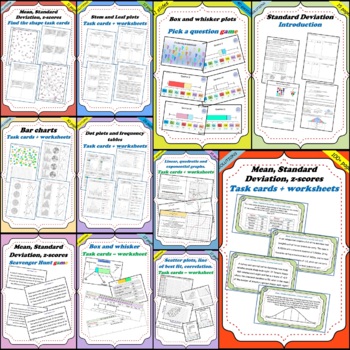
Statistics and charts + Statistics data distribution BUNDLE (450 pages)
This is a bundle package of all of my "Statistics and charts" AND MY "Statistics data distribution" products for a reduced price. This includes a total of 11 products:Statistics and charts:Bar charts, histograms and Circle graphs (1 product, 32 pages).Frequency tables and dot plots (1 product, 28 pages).Stem and leaf plots (1 product, 14 pages).Statistics data distribution:Quartiles and Box and whisker plots (2 products, , 28 pages + 41 slides).Mean, Standard Deviation, z-scores (4 products, 237
Subjects:
Grades:
10th - 12th, Adult Education
Types:
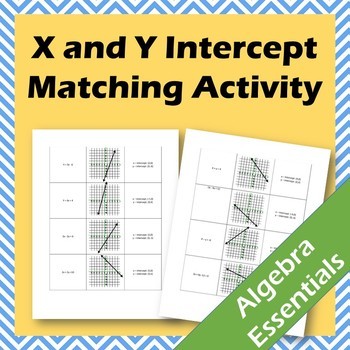
X- and Y-Intercept Matching Activity (CCSS.HSF.IF.B.4)
This matching activity is designed to be practice for students in finding the x- and y-intercepts of a graph and from an equation. Students will have to use critical thinking skills in order to match the three sets. Finding intercepts is a difficult task for students to attain. This practice will help students see the relation between an ordered pair, equation of a line and a graphed line.
You may also like:
X and Y-intercepts Scavenger Hunt
Linear Modeling Projects!
Modeling Activity
Piecew
Grades:
6th - 12th, Higher Education, Adult Education
Types:
Also included in: X & Y Intercept Matching and Scavenger Hunt Bundle (CCSS.HSF.IF.B.4)
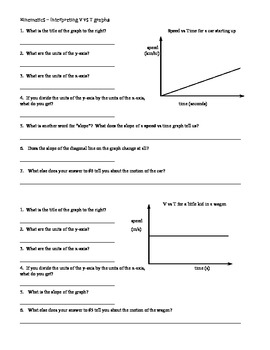
Graphing - Interpreting Velocity vs Time Graphs
I use this worksheet on velocity vs time graphs as a followup to the distance vs time graphs before introducing the kinematic equations. This is primarily for an introductory physical science class or lower level physics class. The goal is to guide students through looking at details of graphs and think about what the graphs mean physically. Key is included as pages 3 and 4.
Subjects:
Grades:
8th - 10th, Adult Education
Types:
Also included in: Graphing Bundle
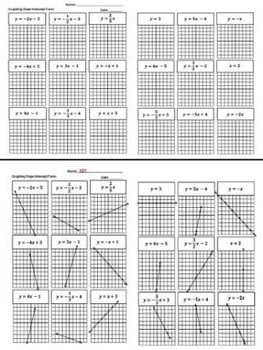
Graphing Slope Intercept Form Linear Equations Worksheet Quiz Review
Graphing Slope Intercept Form Linear Equations Worksheet Quiz Review
This is a 2 page PDF document that assesses a student’s ability to graph slope intercept form equations.
The assignment includes (18) equations and graphs.
The answer key is included.
Need more Linear Equations Resources? Check out these items available in my TpT Store.
4 Types of Slope Foldable
Equations of Lines Foldable
Linear Equations Quiz
Slope Intercept Foldable
Calculate Slope Foldable
Parallel Perpendicular
Subjects:
Grades:
6th - 12th, Adult Education
Types:
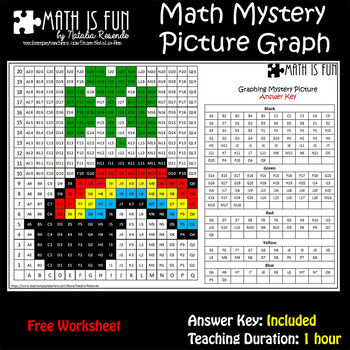
St Patrick Shamrock Rainbow – Math Mystery Picture Graph
This is a fun and easy way to helping our students to study Math. Students will discover the mystery pictures that are made by coloring in the correct squares on the grid using the colors and coordinates given.
• Page orientation: Landscape and Portrait
These are great, engaging activities to use for a math center, indoor recess, substitutes, or fun homework!
Be the first to know about my new discounts, freebies and product launches:
• Look for the green star near the top of any page withi
Subjects:
Grades:
3rd - 6th, Adult Education
Types:
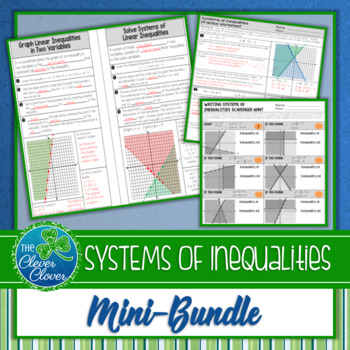
Systems of Inequalities - Guided Notes, Worksheets and a Scavenger Hunt
Included you will find guided notes, a worksheet and a scavenger hunt. Students will practice graphing systems of inequalities and writing inequalities from the graphed solutions. Looking for quality resources on systems of inequalities? This is it!The guided notes were designed on two half pages. These are perfect for students to glue in their notebooks to use as a reference. The first page of notes guides students through graphing linear inequalities in two variables. Students can fill in key
Grades:
7th - 9th, Adult Education
Also included in: Systems of Equations Bundle
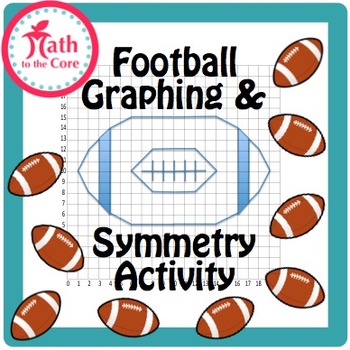
Football Graph and Symmetry Activity for Coordinate Plane
Football Graph and Symmetry Activity for Coordinate Plane
Not only do students need to know how to graph line segments they will use their symmetry skills to complete the football.
This file contains 8 pages.
Football Graph in Quadrant I in color
Football Graph in Quadrant I in black & white
Football Graph in Quadrant I without graphics
Football Graph in Quadrant I Key
Football Graph in Quadrant I, II, III, & IV in color
Football Graph in Quadrant I, II, III, & IV in black &
Subjects:
Grades:
5th - 12th, Higher Education, Adult Education
Types:
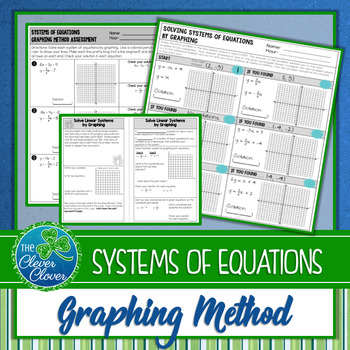
Solving Systems of Equations by Graphing - Notes, Scavenger Hunt and Assessment
This resource includes guided notes, a scavenger hunt, an exit slip and an assessment. Use this resource to reinforce the graphing method. Save time with this mini-bundle!Three half pages of notes provide an opportunity for students to explore solving a system of equations by graphing. The first half page of notes gives students a problem. They are asked to define the variables; write two equations and to graph each equation using a different colored pencil. The last part of these notes explores
Grades:
7th - 9th, Adult Education
Types:
Also included in: Systems of Equations Bundle
Slope Graphic Organizer and Guided Notes
This is a great graphic organizer to help students recall four different ways to find the slope of a linear function. These four ways include: From a graph, an equation, a table, and two given points.
The second graphic organizer helps students have a reference guide for positive, negative, zero, and undefined slope.
This graphic organizer has guided notes, multiple examples, and little tricks to help students remember positive, negative, zero, and undefined slope.
The Link-Slope Task Car
Grades:
6th - 12th, Higher Education, Adult Education
Showing 1-24 of 335 results


