1,420 results
11th grade graphing handouts

Coordinate Plane Graphing Mystery Pictures, No PREP Science Sub Plans, Math
Click on italic link below to see more images:CoordinatePicturesImages Heather C.Rated 5 out of 5Extremely satisfied"I'm in love with this resource! I love all the different characters especially Scar! My students were engaged and can now plot points correctly."Favorite math activity for students! Teachers have commented how students love this activity! Even teachers love doing them! :) This activity will SAVE YOU over 150 plus hours of class work! Education related and even use it for sub plans
Grades:
6th - 12th, Higher Education, Adult Education
Types:
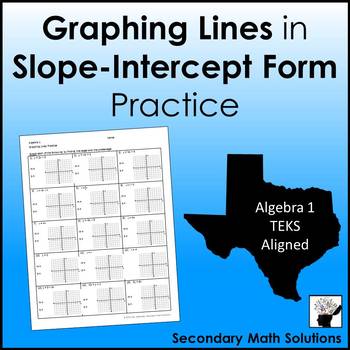
Graphing Lines in Slope-Intercept Form Practice
This is a one-sided practice page on graphing lines in slope-intercept form. There are 15 practice problems designed for the beginning grapher. Almost all of the equations are in y = mx + b format. The student first identifies m and b from the equation then uses them to graph. The two special cases are included and only a few equations need some "adjustment" such as 3y = 6x. Key included.Also available:Graphing Lines in Slope-Intercept Form NotesGraphing Lines Partner Activity Task Cards© 2015 S
Subjects:
Grades:
8th - 11th
Types:
Also included in: Linear Functions Unit Bundle - Algebra 1 Curriculum
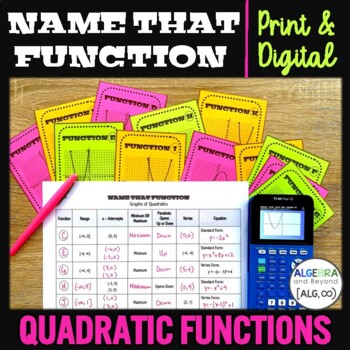
Graphing Quadratic Functions | Matching Review Activity | Practice Worksheets
Students make connections with functions and graphs in this Quadratic Functions matching activity. These print and digital practice worksheets include a fill-in-the blank table, with some information already given. Then, students match the quadratic graphs to the characteristics and fill in the missing information. This quadratic function review activity will have your students comparing and contrasting functions and graphs in a creative way.No prep – simply print or share digitally for an insta
Subjects:
Grades:
9th - 11th
Types:
CCSS:
Also included in: Quadratic Functions Review Activities Mini-Bundle | Graphing | Factoring
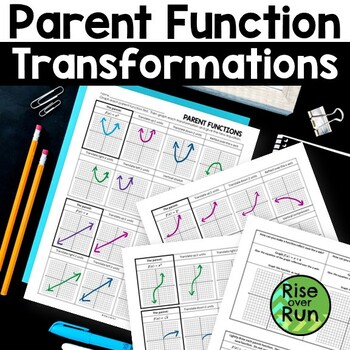
Transformations of Functions Exploration Activity with Graphs & Equations
Want your students to really understand how to transform parent functions? This activity allows them to explore how changes in the graph relate to changes in the equations. This can be used as an inquiry activity to help students discover how the parts of a function directly affect the graph. This resource includes the following parent functions:QuadraticLinearExponentialAbsolute ValueCubicSquare RootRationalConstantThe activity begins with exploring how to transform a quadratic function. Quadra
Grades:
9th - 11th
Types:
Also included in: Algebra 1 Discovery Lessons and Inquiry Activities Bundle
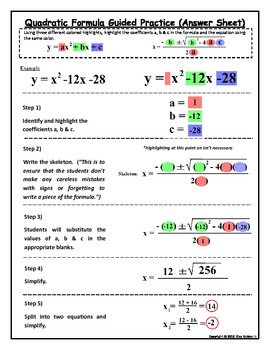
Quadratic Formula Lesson
These worksheets shows how I teach the quadratic formula. I have found that students understand and grasp the formula easier with what I call the "skeleton method". The product comes with a guided practice with and answer key, and 3 worksheets where students can work out problems using the same method. The initial problems are not given, just the graphic organization. Just copy some quadratic functions from a text book on the board and have them use those. This lesson uses highlighters to
Subjects:
Grades:
9th - 11th
Types:
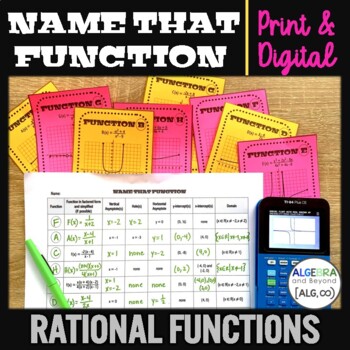
Graphing Rational Functions | Matching Review Activity | Practice Worksheets
Students make connections with functions and graphs in this Rational Functions matching activity. These print and digital practice worksheets include a fill-in-the blank table, with some information already given. Then, students match the graphs to the characteristics and fill in the missing information. This rational function review activity will have your students comparing and contrasting functions and graphs in a creative way. No prep – simply print or share digitally for an instant, interac
Subjects:
Grades:
10th - 12th
Types:
CCSS:
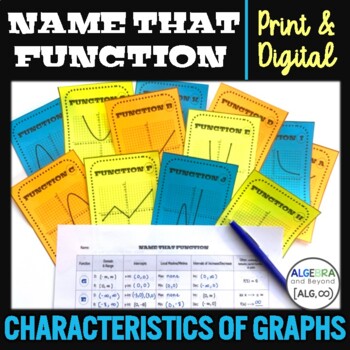
Identifying Parts of Functions and Graphs - Matching Activity | Print & Digital
Students make connections with functions and graphs in this Characteristics of Functions matching activity. These print and digital practice worksheets include a fill-in-the blank table, with some information already given. Then, students match the graphs to the characteristics and fill in the missing information. This identifying parts of functions review activity will have your students comparing and contrasting functions and graphs in a creative way.No prep – simply print or share digitally f
Subjects:
Grades:
9th - 12th
Types:
CCSS:
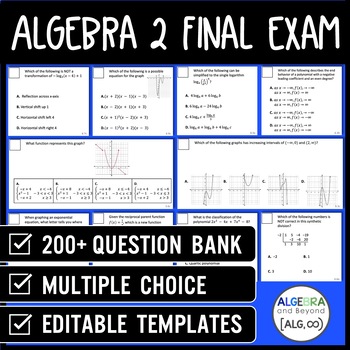
Algebra 2 Midterm and Final Exam | Semester Review | End of the Year Assessments
Do you want an easy way to create a midterm or final exam for Algebra 2? Functions and graphing included – linear, quadratic, exponential, logarithmic, radical, polynomial, rational, trigonometry and more! This EDITABLE assessment includes over 200 pre-made multiple choice questions, empowering you to create a truly unique exam for the semester or the full year! Simply drag and drop the questions into the template, and voila, your exam is ready to print and go!INCLUDED:- Exam Template- 200+ Que
Subjects:
Grades:
9th - 11th
Types:
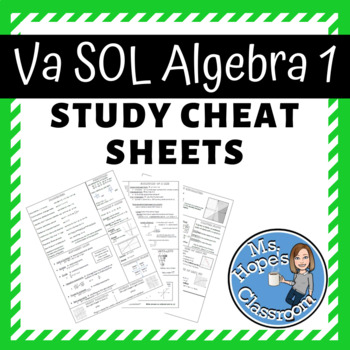
Algebra 1 Review Cheat Sheet for SOL!
REVIEW SHEETS THAT INCLUDE THE FOLLOWING TOPICS:Coordinate PlaneDirect and Inverse VariationDomain and RangeEquations of a LineExponent LawsFactoringFunctionsGraphing InequalitiesLine and Curve of Best FitMultiplying PolynomialsPropertiesQuadraticsScatter plotsSlope and GraphingSquare and Cube RootsSystems of EquationsI give this sheet to my students as we prepare for the SOL tests so that if they get stuck, they can refer to the sheet to help jog their memory.Calculator instructions for various
Subjects:
Grades:
7th - 11th
Types:
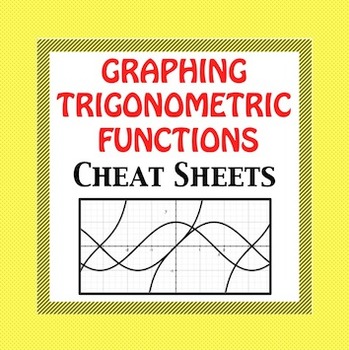
Trig Functions - Graphing Cheat Sheet
Trig Functions - Graphing Cheat Sheet*****UPDATED with different formula versions******Text books make graphing trig functions so complicated. I have simplified the process so that even below average students can follow the process easily and graph trig functions without frustration. I have passed these trig notes out to absent students and NO explanation was necessary! Trig graph paper also is included.The different versions use different formulas and variables.y = asin(bx−c)+d y = asi
Subjects:
Grades:
10th - 12th, Higher Education, Adult Education
Types:
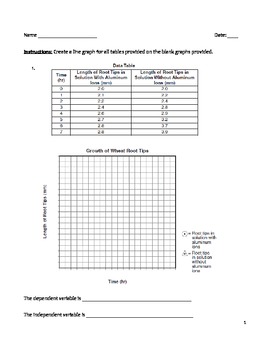
High School Science Graphing Worksheet - Making Line Graphs in Science
Use this worksheet to help your students practice making line graphs. In addition, they will have to identify both the independent and dependent variables. Hopefully, they will make the connection between the variables and their placement on the graph. There is a key provided for the teacher. There are ten line graphs for students to work with.
line graph, plot points, independent variable, dependent variable, data table, uniform scale, x-axis, y-axis
Subjects:
Grades:
8th - 12th
Types:
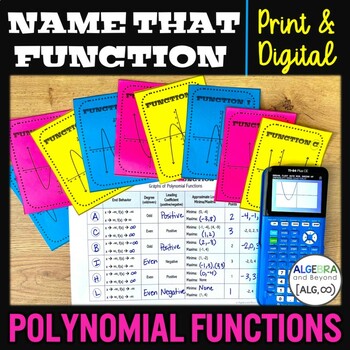
Graphing Polynomial Functions - Matching Review Activity | Print and Digital
Students make connections with functions and graphs in this Polynomial Functions matching activity. These print and digital practice worksheets include a fill-in-the blank table, with some information already given. Then, students match the graphs to the characteristics and fill in the missing information. This polynomial function review activity will have your students comparing and contrasting functions and graphs in a creative way.No prep – simply print or share digitally for an instant, inte
Subjects:
Grades:
9th - 11th
Types:
CCSS:
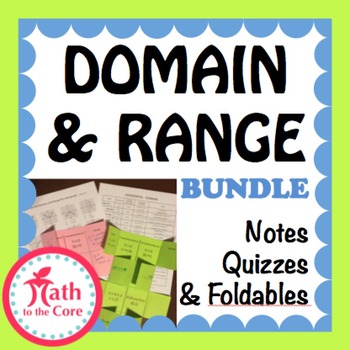
Domain and Range of a Graph Bundle
Domain and Range of a Graph Notes, Homework, and Quiz Bundle
with inequality, interval, and set builder notation
This will stop all confusion of Domain and Range Notation!!!
My students find the chart invaluable especially the Vertical Graph depictions.
Included in this package
1. Complete Chart for Domain and Range Notation
2. Complete Chart for Domain Notation
3. Complete Chart for Range Notation
4. Foldable Template
5. Quiz 1 (easy) version A
6. Quiz 1 Key
7. Quiz 2 (easy) version
Grades:
7th - 12th, Higher Education, Adult Education
Types:
Linear Functions
Linear Functions
This is a great one page cheat sheet on the following three forms of a line...
Intercept Form, Point Slope Form, and Standard Form
Also included, is how to find intercepts and slopes.
Two sheets are included, one in color and the other in black and white.
Easily made into a tri-foldable.
Connect with Me
Follow my WebsiteMath to the Core on FacebookMath to the Core BlogMath to the Core on PinterestMath to the Core on TwitterMath to the Core on Instagram
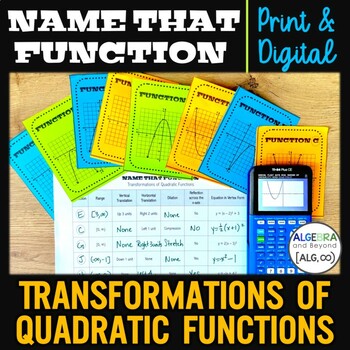
Graphing Quadratic Functions - Transformations, Vertex & Standard Form Activity
Students make connections with functions and graphs in this Transformations of Quadratic Functions matching activity. These print and digital practice worksheets include a fill-in-the blank table, with some information already given. Then, students match the graphs to the characteristics and fill in the missing information, including writing in vertex form and standard form. This quadratic function review activity will have your students comparing and contrasting functions and graphs in a creati
Subjects:
Grades:
9th - 11th
Types:
CCSS:
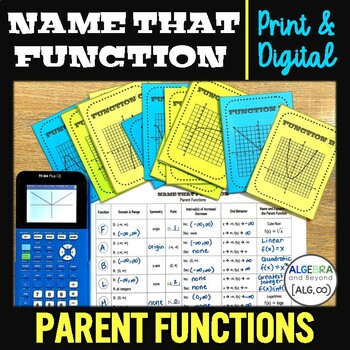
Identify Parent Functions | Graphing Activity | Linear, Quadratic, Exponential
Students make connections with functions and graphs in this Parent Functions matching activity. These print and digital practice worksheets include a fill-in-the blank table, with some information already given. Then, students match the graphs to the characteristics and fill in the missing information. This parent function review activity will have your students comparing and contrasting functions and graphs in a creative way.No prep – simply print or share digitally for an instant, interactive
Subjects:
Grades:
9th - 12th
Types:
CCSS:
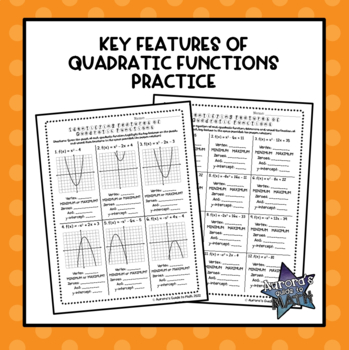
Key Features of Quadratic Functions
Key Features of Quadratic FunctionsThis no-prep resource is a great way to get students to practice identifying the key features of quadratic functions! This resource contains four pages of practice for a total of 28 practice problems! Each of the first three pages focus on a different representation of a quadratic (a page of graphs, a page of tables, and a page of equations). The fourth page contains multiple choice questions for test prep practice. This is a great way for students to practice
Subjects:
Grades:
6th - 12th
Types:
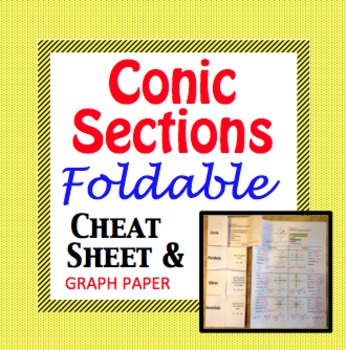
Conic Sections Cheat Sheet - Foldable for Circle, Parabola, Ellipse, Hyperbola
Conic Sections Cheat Sheet - Foldable for Circle, Parabola, Ellipse, and Hyperbola. Graph paper included!
*** UPDATED *** Now with highlighted a,b, and c lengths AND a version with parametric equations.
Create a foldable or just pass out the Conic cheat sheet, the choice is yours.
Please view my free preview.
I also use the unfilled conic foldable as a quiz or pretest warmup.
This is a comprehensive guide to the 4 conic sections (circle, parabola, ellipse, and hyperbola).
This file inc
Subjects:
Grades:
9th - 12th, Higher Education, Adult Education
Types:
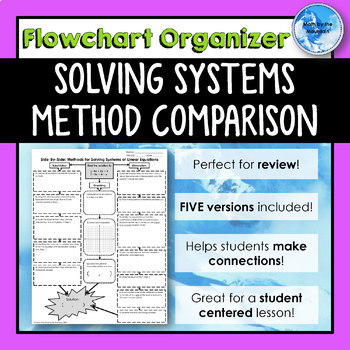
Solving Systems of Equations METHOD COMPARISON *Flowchart* Graphic Organizer
Help your students compare and review the three methods for solving systems of equations: graphing, substitution, and elimination. FIVE versions are included to fit your needs!A BLANK Flowchart that can be used to compare methods of solving ANY system of linear equations as well as FOUR unique example problems that cover a range of solving scenarios. This flowchart is a great conversation starter for when one method will be more efficient than another, as well as review. When I teach the sys
Subjects:
Grades:
7th - 12th
CCSS:
Also included in: Systems of Equations *Flowchart* Graphic Organizers BUNDLE
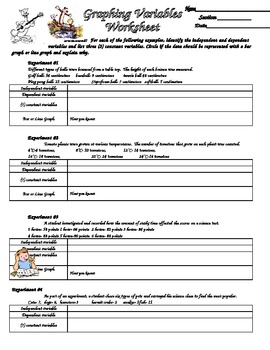
Scientific Method Variables and Graphing Practice
Students are given six different sets of experimental data and asked to identify the variables (independent, dependent etc.). They also reinforce graphing by identifying if the data should be represented with a bar or line graph. With this information, students the create data tables and graphs for the data.
Subjects:
Grades:
3rd - 12th
Types:

FUNCTIONS - Piecewise Linear Functions
Piecewise Functions can be difficult for students. The idea that a function can be in pieces is not readily accepted or understood.
Whether you’ve already taught this topic or need to reteach it, this resource will provide meaningful practice for your students.
Included are 4 worksheets.
Evaluating Piecewise Functions (10 questions)
Writing Piecewise Functions (4 questions)
Graphing Piecewise Functions (4 questions)
Piecewise Functions in Real Life (10 questions)
A template is also included
Subjects:
Grades:
9th - 12th
Types:
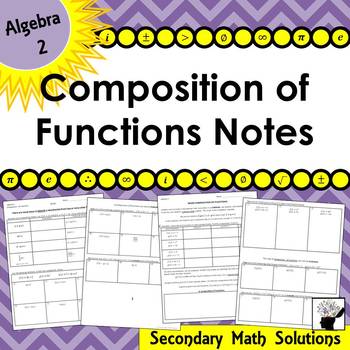
Composition of Functions Notes
This is a set of 2 double-sided notes pages over Composition of Functions. TEKS Aligned: 2A.2DThe first set of notes introduces the topic of finding composite functions with adding, subtracting, multiplying and dividing 2 functions and multiplying a function by a scalar. A place for the student to take notes and work an example is included followed by 6 more examples. Next, the student evaluates these same compositions with 6 guided examples and 3 independent practice examples. The second set of
Subjects:
Grades:
9th - 12th
Types:
Also included in: Algebra 2 Curriculum - Texas TEKS Aligned
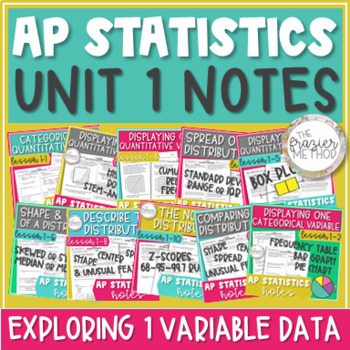
AP Statistics Notes Unit 1 Histogram, Box Plot, Skew, Mean, Normal Distribution
Use these AP® Statistics notes to teach UNIT 1 – EXPLORING ONE-VARIABLE DATA. Histograms, box plots, dot plots, stem-and-leaf plots, bar graphs, outliers, 5-number summary, z-scores, Normal Distribution / Normal Model, and describing a distribution's shape, center, & spread! Skewed or symmetric, median or mean, standard deviation or interquartile range... You can also use these notes for AP® Stats exam review! Aligns with the updated 2019-2020 objectives and standards of Unit 1: Exploring On
Subjects:
Grades:
10th - 12th
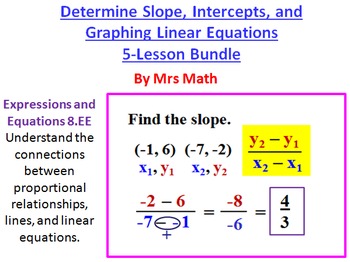
Slope, Intercepts, and Graphing Linear Equations Power Point 5 Lesson Pack
PDF and Microsoft word versions included.Are you looking for an all inclusive package that has everything you need to teach finding the slope, intercepts, and graphing equations? This is it! Lesson Power Points, classworks, homeworks, quizzes, a set of test questions, and even some teaching tips embedded in the lesson for instruction. If you are teaching this topic from scratch these resources will be a lifesaver. They can also be an excellent supplement to the resources you are already usin
Showing 1-24 of 1,420 results


