TPT
Total:
$0.00

Bivariate Data Unit 8th Grade Math CCSS | Scatter Plots and Frequency Tables

Rated 5 out of 5, based on 2 reviews
5.0 (2 ratings)
;
Make Sense of Math
4.7k Followers
Grade Levels
8th - 9th, Homeschool
Standards
Formats Included
  • Zip
$18.00
List Price:
$27.00
You Save:
$9.00
Bundle
$18.00
List Price:
$27.00
You Save:
$9.00
Bundle
Share this resource
Report this resource to TPT
Make Sense of Math
4.7k Followers

What educators are saying

This is an engaging way to give guided notes with examples. It is not easy to print and get it just right so each student can have their own little booklet. But it is worth it to make and give out.

Products in this Bundle (6)

    showing 1-5 of 6 products

    Bonus

    Bivariate Data Guide with Links
    Also included in
    1. Looking for ways to simplify planning while continuing to teach in-depth lessons? This 8th grade math curriculum and activities bundle is for you! This math curriculum is aligned to the 8th grade common core standards. Each unit includes: guided notes, assessments/worksheets and activities such as:
      Price $200.00Original Price $339.00Save $139.00

    Description

    This bivariate data unit includes notes, assessments, and stations. This is perfect for your students to dive into scatter plots, lines of best fit and two-way frequency tables. In-depth notes to teach and fun activities to supplement. Aligned to 8th grade math CCSS

    By purchasing this bundle, you are saving more than 30% off the full value of the individual resources

    Included in this Bundle

    • Assessments: CCSS Aligned and Free Response
    • Scatter Plots
      • Guided Notes
      • Stations
      • Geometric Design Activity Google Slides and Printable

    • Frequency Tables
      • Guided Notes
      • Geometric Design Activity GOOGLE Slides and Printable

    ALL 8th Grade Math Units

    1. The Real Number System
    2. Exponents, Scientific Notation, & Roots
    3. Solving Equations with Variables on Both Sides
    4. Linear Relationships and Functions
    5. Systems of Equations
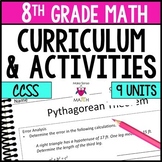
    6. Pythagorean Theorem
    7. Parallel Lines and Transformations
    8. Volume of Cones, Cylinders, and Spheres
    9. Bivariate Data

    Check out the preview for a closer look at the included resources

    SAVE even more with the entire 8th Grade Curriculum and Activities Bundle

    FOLLOW ME for more great products to make sense of math!

    Remember that leaving feedback earns you points toward FREE TPT purchases!

    Please feel free to contact me with any questions!

    Michelle,

    Make Sense of Math

    makesenseofmath@yahoo.com

    Total Pages
    Answer Key
    Included
    Teaching Duration
    N/A
    Report this resource to TPT
    Reported resources will be reviewed by our team. Report this resource to let us know if this resource violates TPT’s content guidelines.

    Standards

    to see state-specific standards (only available in the US).
    Construct and interpret scatter plots for bivariate measurement data to investigate patterns of association between two quantities. Describe patterns such as clustering, outliers, positive or negative association, linear association, and nonlinear association.
    Know that straight lines are widely used to model relationships between two quantitative variables. For scatter plots that suggest a linear association, informally fit a straight line, and informally assess the model fit by judging the closeness of the data points to the line.
    Use the equation of a linear model to solve problems in the context of bivariate measurement data, interpreting the slope and intercept. For example, in a linear model for a biology experiment, interpret a slope of 1.5 cm/hr as meaning that an additional hour of sunlight each day is associated with an additional 1.5 cm in mature plant height.
    Understand that patterns of association can also be seen in bivariate categorical data by displaying frequencies and relative frequencies in a two-way table. Construct and interpret a two-way table summarizing data on two categorical variables collected from the same subjects. Use relative frequencies calculated for rows or columns to describe possible association between the two variables. For example, collect data from students in your class on whether or not they have a curfew on school nights and whether or not they have assigned chores at home. Is there evidence that those who have a curfew also tend to have chores?

    Reviews

    Questions & Answers

    4.7k Followers