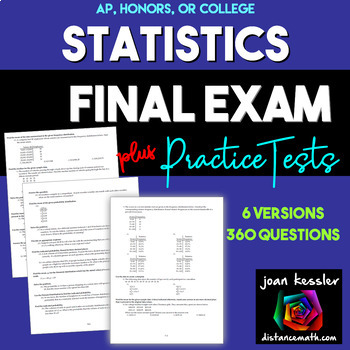
Statistics Final Exam and Review [AP, College, and Honors]
- PDF
- Easel Activity
What educators are saying
Description
You can use this Statistics Final Exam in an AP Statistics, Honors Statistics, or a College Statistics course as an assessment, review or both.
What's Included?
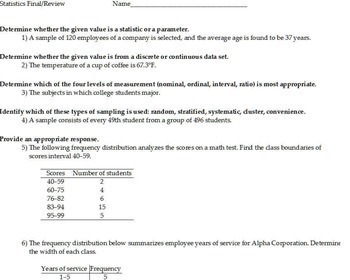
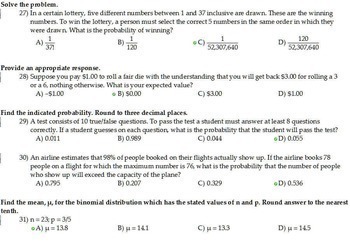
- Included are 6 different versions, each including 60 well chosen representative questions in both multiple choice format and also in free response format*. These reviews and tests work well in class or as a take- home. The tests are editable with Adobe Acrobat Pro.
- Each test should take about 2 - 3 hours and can be taken with a graphing calculator. This test has been given and is quite successful with generally a B to B+ average.
- Answer keys
What Topics are Included?
- Organizing Data
- Histograms
- Measures of Central Tendency
- Measures of Variation
- Measures of Position
- Sample Spaces and Probability
- The Addition Rules of Probability
- The Multiplication Rules and Conditional Prob.
- Counting Rules
- Probability and Counting Rules
- Probability Distribution
- Mean, Variance, Standard Deviation
- The Binomial Distribution
- Properties of a Normal Distribution
- The Standard Normal Distribution
- Applications of the Normal Distribution
- The Central Limit Theorem
- Confidence Intervals for the mean
- Confidence Intervals and Sample Size for Prop.
- Confidence Intervals and Sample Size for Prop.
- Confidence Intervals for the mean
- Confidence Intervals and Sample Size for Prop.
- Confidence Intervals for Variances and Standard deviation
- Steps in Hypothesis Testing Z test for a mean
- T test for a mean
- Z test for a proportion
- Regression
This resource can also be used for a practice test or study guide. It can be given one page at a time for a great review topic by topic week by week as the final approaches . Please note: It is NOT in "AP style", but is comprehensive, and would make a great review for AP as well as College Statistics, and Honors Statistics. It is also a great review for the Statistics part of the EIT Engineering Exam, or the MCAT.
⇒ *Please note, there are some duplicate questions on the free response tests
especially at the beginning. My students told me that this was entrapment to catch them cheating...I smiled.
_________________________________________________________
You may also like:
★ Statistics Final Review Task Cards
★ Hypothesis Testing Graphic Organizer
★ Confidence Intervals on the TI 83-TI 84
★ Normal Distribution Applications with GOOGLE Slides
★ Interactive Normal Distribution App with free software
★ The Normal Distribution on the TI 83 - 84 Plus Applications
★ Permutations and Combinations Task Cards QR
★ Linear Regression on the TI 83 84
★ TI-83 TI-84 Mega-Bundle of 26 Teaching Learning Handouts
__________________________________________________
Connect with me:
✓ Sign up at Joan's World of Math to access my exclusive Free Resource Library
✓ Visit my Facebook Page
✓ Follow me on Instagram
✓ Email me at: joan@joansworldofmath.com with any questions
LICENSING TERMS: The purchase of a license for this resource is for use by one teacher only for his or her students only. No part of this resource is to be shared with colleagues or used by an entire department, school, or district without purchasing the proper number of licenses.
COPYRIGHT TERMS: ©2017-2024Joan Kessler (joansworldofmath.com™). This resource may not be uploaded to the internet in any form, including classroom/personal websites or network drives, unless the site is password protected and can only be accessed by students.
AP® is a registered trademark of the College Board® which was not involved in the creation of this product and does not endorse this product nor any that are linked on this page


