429 results
10th grade Common Core HSS-ID.A.3 resources
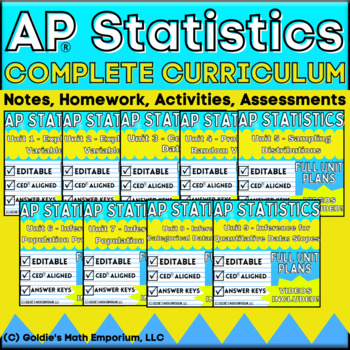
Goldie's FULL CURRICULUM for AP® Statistics
AP® Statistics Full CurriculumIn this product, you will receive all of Goldie's products related to AP® Statistics. All 9 units follow the College Board's© CED and include the following:Student Guided NotesStudent notes are "fill in the blank" style notes; teachers lead the lesson and work with students to complete the content. All content from the AP® CED is included and taught in the notes for this curriculum.Content VideosEach set of notes has a video to accompany it, where I teach the lesson
Subjects:
Grades:
10th - 12th
Types:
CCSS:
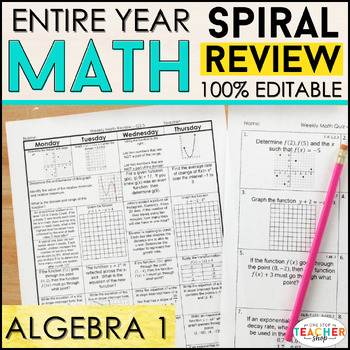
Algebra 1 Spiral Review | Homework, Algebra 1 Warm Ups, Progress Monitoring
This Algebra 1 spiral review & quiz resource can easily be used as HOMEWORK, WARM-UPS, or a DAILY MATH REVIEW! This resource was designed to keep math concepts fresh all year and to help you easily track student progress. All pages are 100% EDITABLE and easy to differentiate to fit your students' needs.⭐⭐UPGRADE for just $10 and get both PRINT & DIGITAL versions } CLICK HERE✪ CLICK HERE to see more SUBJECTS & GRADE LEVELS!★★SAVE $$ with these BUNDLES★★Algebra 1 Bundle: Spiral Review,
Subjects:
Grades:
8th - 10th
Types:
CCSS:
Algebra 1 Google Forms Semester 2 Digital and Printable Homework Bundle
This bundle includes all SEMESTER 2 Algebra 1 editable Google Forms homework assignments, quizzes, and tests that I have created. Every assignment also includes a "worksheet" that corresponds with the questions on each form. Just assign digitally or print + go!Not 1:1? Not using Google Classroom, yet? All of these assignments also come with a stand-alone "worksheet" that may be used with or instead of the digital resource. The SEMESTER 2 BUNDLE includes concepts within the following units:
Subjects:
Grades:
8th - 11th
Types:
CCSS:
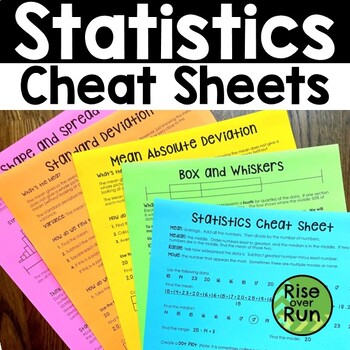
Statistics Cheat Sheets Notes with MAD, Standard Deviation, Shape & Spread
Grab these guided notes and "cheat sheets" to help your students understand statistics standards from Algebra I. Included Topics: Statistics Basics (mean, median, mode, range, dot plots, histograms, stem and leaf plots) Box and Whiskers Mean Absolute Deviation Standard Deviation Shape and Spread (Skewed Left and Skewed Right) The set includes each topic in the format of a cheat sheet and guided notes. The cheat sheets already have all the information filled in. They can be printed and given
Subjects:
Grades:
9th - 10th
Types:
CCSS:
Also included in: Algebra 1 and 8th Grade Math Curriculum Bundle for Entire Year
Oscar Winner -- Data Analysis & Statistics Inquiry - 21st Century Math Project
Utilize the last twenty years of Oscar winners as a data set to guide your students through creating box and whisker plots, histograms, and exploring mean, median, and mode -- in one 21st Century Math Project!Does the age of the award winning star in a film relate to the overall gross of the movie? Student will explore this inquiry question and use the data to support their conclusion.In this 8 page document you will be given a mapping to the Content Standards, an outline for how to implement t
Subjects:
Grades:
6th - 12th
Types:
Goldie’s AP® Statistics UNIT 1 PLANS – Exploring One Variable Data
AP® Statistics Unit 1 – Exploring One Variable DataUnit BundleThis unit contains everything you need to teach "Exploring One Variable Data" in AP® Statistics or regular-level Statistics. Students will go through how to represent quantitative and categorical data with various graphs and tables; find and interpret various measures of center and spread; and calculate and compare positions and percentiles in a normal distribution. This unit is part of my larger unit bundle: Goldie's AP® Statistics F
Subjects:
Grades:
10th - 12th
Types:
CCSS:
Also included in: Goldie's FULL CURRICULUM for AP® Statistics
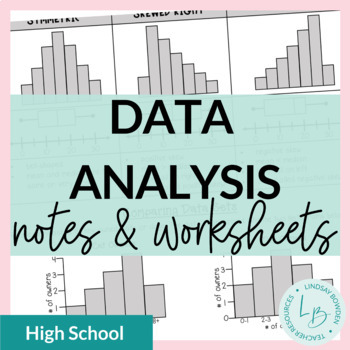
Data Analysis: Shape, Center, and Spread Notes and Worksheets
These data analysis notes and worksheets compare two data sets with regards to shape, center, and spread of data.They cover:comparing data of two sets using histograms, dot plots, box and whisker plots,and stem and leaf plotsshape (symmetrical, skewed right, skewed left)center (mean, median)peaks (mode)spread analyzing what these factors mean in context of the problem4 pages + all answer keysYou may also like:Mean, Median, and Mode Notes & WorksheetsBox and Whisker Plots Notes & Workshee
Subjects:
Grades:
8th - 10th
CCSS:
Also included in: Statistics Unit Bundle
Statistics Project - Statistics Olympics
Engage your students in their study of statistics as they compete in self-created Olympic style events. This project will engage students and help them discover meaning and apply concepts including measures of central tendency, quartiles, outliers, variance, standard deviation, z-scores, box plots, histograms, normal and skewed distributions. This project can be completed in approximately 6-8 days (50-min class periods) ** March 2023 Update **Visual updates to all slides and documentsRubric ali
Subjects:
Grades:
6th - 12th
CCSS:
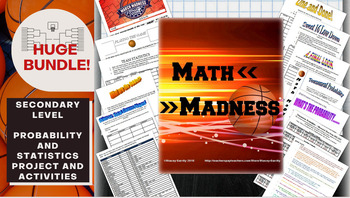
Math March Madness Full Tournament Project {BUNDLE}
Harness the excitement of NCAA March Madness with this huge project for secondary math teachers that follows all stages of the tournament! This Common Core aligned bundle comes with bonus parts not sold individually in my store so you can create a rich immersion in the tournament, practice probability and statistics and learn some interesting new ones along the way! Save $3 plus get bonus content by bundling!You can pick and choose which parts you would like to incorporate, or follow my schedu
Subjects:
Grades:
6th - 12th, Higher Education
Types:
Goldie's AP® Statistics Semester 1 Multiple Choice Questions Bundle
AP® StatisticsSemester 1 (Units 1 - 4)Multiple Choice Questions (MCQ) Practice This is a resource that has 140 AP-level multiple-choice questions. You will receive the editable Word document for this resource, making it easy to modify and copy these questions in your classroom. You will also receive the PDF version for easy formatting. The answer key for this resource is included. These are BRAND NEW AP questions that I have developed for AP Statistics. These questions are not used anywhere else
Subjects:
Grades:
10th - 12th
Types:
CCSS:
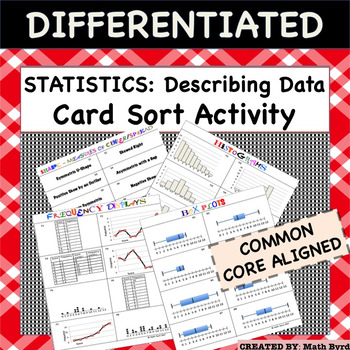
Statistics:Representing & Interpreting Data (Histogram, Box Plot, Dot Plot)
Complete Lesson! This lesson features a 40 CARD SORT, Differentiated Cornell Notes, Distribution Shapes Graphic Organizer, and Power Point to go with the notes! Perfect for the inclusive classroom! Within the Card Sort Activity there are 5 categories of cards to match: 1) Histogram2) Frequency Display (including Dot Plots, Frequency Line Graphs and Tables)3) Box Plots4) Describing Shape5) Describing Measures of Center & Spread. With 8 different sets of matches, there are 40 cards total. Stud
Subjects:
Grades:
8th - 12th
Types:
CCSS:
Also included in: Common Core Algebra 1 CARD SORT ACTIVITIES - BUNDLE PRICE!
![Preview of Statistics Final Exam and Review [AP, College, and Honors]](https://ecdn.teacherspayteachers.com/thumbitem/Statisticis-FinalReviewStudy-Guide-Exam-1711356723/original-699492-1.jpg)
Statistics Final Exam and Review [AP, College, and Honors]
You can use this Statistics Final Exam in an AP Statistics, Honors Statistics, or a College Statistics course as an assessment, review or both. What's Included?Included are 6 different versions, each including 60 well chosen representative questions in both multiple choice format and also in free response format*. These reviews and tests work well in class or as a take- home. The tests are editable with Adobe Acrobat Pro. Each test should take about 2 - 3 hours and can be taken with a graphin
Subjects:
Grades:
10th - 12th, Higher Education
Types:
CCSS:
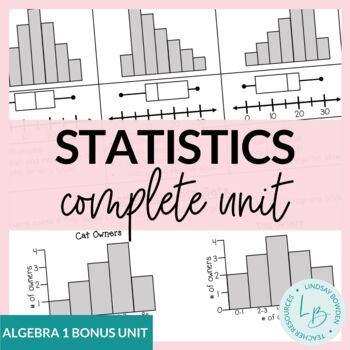
Statistics Unit Bundle
This is a complete statistics unit for an Algebra 1 course. All assessments (quizzes, study guide, and test) are editable to fit your needs. This unit is included in my Algebra 1 Curriculum.*Note: This unit is best suited for on-level or lower-level/special education math classes. Supplements will most likely be needed for an honors or upper-level math class.*This unit now contains video lessons for every lesson!*Topics Covered:Mean, Median, Mode ReviewStem and Leaf PlotsHistogramsDot PlotsRange
Subjects:
Grades:
8th - 10th
CCSS:
NC Math 1 *PRACTICE LIKE A CHAMPION* Complete Bundle (552 EOC Aligned Items)
This bundle includes practice items for ALL 46 NC Math 1 state standards - 12 items per standard for a total of 552 practice EOC items in all.Perfect for end of semester review and practice for the NC Math 1 EOC or to usethroughout the course to assess student understanding on any standard at any time. Since the items are grouped by standard, they are perfectly organized for analyzing student data!Each standard's item set is also available individually in my TpT store, along with a full length P
Subjects:
Grades:
7th - 10th
Types:
CCSS:
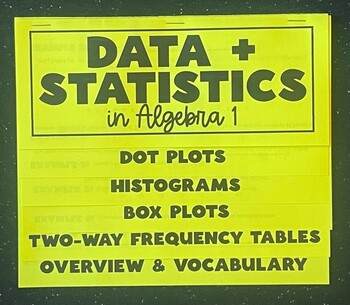
Data and Statistics in Algebra 1 Foldable Notes - Fully Editable
This editable algebra 1 foldable provides an introduction and overview for most of the univariate and bivariate data and statistics taught in the Algebra 1 standards. It is organized by the following tabs:Dot PlotsHistogramsBox PlotsTwo-Way Frequency TablesOverviewWithin the foldable there are at least two examples for each type of graph. It also allows for you to review/ address the following terms: mean, median mode, range, interquartile range, outliers, standard deviation, marginal and joi
Grades:
8th - 10th
CCSS:
Also included in: Data Analysis and Statistics Foldable Bundle
NC Math 1 Practice End-of-Course Test (North Carolina EOC Final Exam Review)
This full length 60-item multiple choice practice test is aligned to the North Carolina Standards for Math 1. It includes 16 non-calculator active questions and 44 calculator active questions. An answer key and item/standard alignment is included for easy data analysis.
Subjects:
Grades:
7th - 10th
Types:
CCSS:
Algebra 1 Curriculum
Get a complete High School Algebra 1 curriculum including units on solving equations and inequalities, linear functions, exponents and exponential functions, factoring polynomials, quadratics, and more! These ready-to-use Algebra 1 resources include everything you need to teach high school algebra to your on-level or lower-level/special education class. Supplements would be needed for an honors class.Each unit contains guided notes, practice worksheets for the classroom and/or homework, activiti
Grades:
8th - 11th
CCSS:
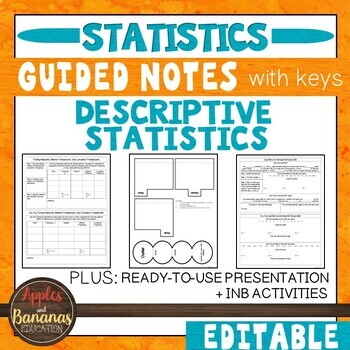
Descriptive Statistics- Guided Notes, Presentation, and INB Activities
This Introduction to Statistics product is flexible, editable, and can be used for in-person or distance learning. Take the time and stress out of creating your own guided notes and presentations. There are many ways to use this engaging bundle. It includes guided notes embedded with student practice problems (keys included), foldable activities, and a PowerPoint presentation for focused instruction. Choose what works best for your class/student and modify to make the content fit your needs. Not
Subjects:
Grades:
9th - 12th
CCSS:
Also included in: Custom Bundle for Viet
Data Analysis and Statistics MEGA Bundle (Algebra 2 - Unit 13)
This is a MEGA Bundle of GUIDED NOTES WITH VIDEO LESSONS for your distance learning needs, homework, daily warm-up, content quizzes, mid-unit and end-unit assessments, review assignments, and cooperative activities for Algebra 2 Honors UNIT 13: DATA ANALYSIS & STATISTICS. #distancelearningtpt⭐Guided Student Notes⭐ 8-Page-Bound-Book-Style Foldables⭐ Google Slides®⭐ Fully-editable SMART Board® Slides⭐ Homework/Practice assignment⭐ Lesson Warm-Up (or exit ticket)⭐Daily Content Quiz (homework ch
Subjects:
Grades:
8th - 11th, Higher Education
CCSS:
Version B End of Unit Assessments/Retakes for IM Algebra 1 Math™ Units 1-7
This is a Version B Assessment bundle aligned to Illustrative Mathematics for Algebra 1. This Version B assessment bundle is aligned to the same CCSS standards as the original exams and is modeled after the same type of problems accompanying the Algebra 1 exams. So, it naturally lends to standards based grading, if that is a practice in which you choose to participate. This exam can be used as a retake for students to show mastery after reteaching lessons or student independent study or it can b
Subjects:
Grades:
8th - 11th
Types:
CCSS:
High School Data Analysis Project
This project covers a large range of data analysis methods. There are eleven total parts to the project.
Part One: the students have to collect data from 20 students outside of the classroom. Directions specify to ask students from each grade level.
Part Two: Measures of Center and Variation. Students will calculate mean, median, mode, range, and standard deviation for some of the data collected. Definitions of each term are included.
Part Three: Box-And-Whisker Plot. Students will create t
Subjects:
Grades:
9th - 12th
Types:
CCSS:
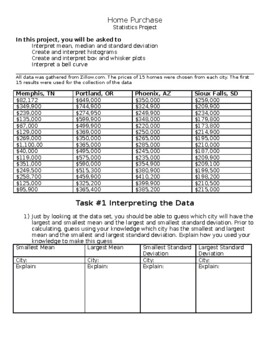
Home Prices: High School Statistics Project
This statistics project has students exploring home prices and using their knowledge of mean, median, standard deviation, histograms, box and whisker plots, and bell curves to make predictions and inferences about the data. This project is provided in a word document to allow the teacher the ability to edit the document or load it to a google doc. In this project students first make predictions about measures of spread and central tendency without calculating but by looking at the data. Students
Subjects:
Grades:
9th - 12th
Types:
CCSS:
ALGEBRA 1 - ASSESSING EVERY STANDARD (bundle)
Have you tried to find quick assessments for ALGEBRA 1?So have I! After giving up the search, I made my own. This MEGA BUNDLE provides 48 mini-assessments for all the Algebra 1, Common Core standards;Number Quantity: NQ.1-3 (3 assessments)Creating Equations: CED.1-4 (4 assessments)Reasoning with Equations and Inequalities: REI. 1,3-7, 10-12 (9 assessments)The Real Number System: RN.1-3 (3 assessments)Interpreting Functions: FIF.1-9 (9 assessments)Building Functions: FBF.1-4 (4 assessments)Linea
Subjects:
Grades:
7th - 10th
Types:
CCSS:
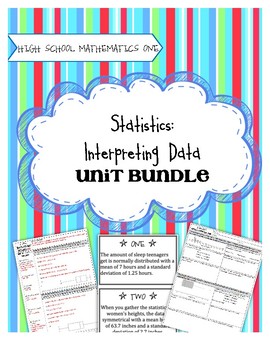
High School Math 1: Statistics and Interpreting Data
Task-Based Learning gets students intrinsically motivated to learn math! No longer do you need to do a song and dance to get kids interested and excited about learning. The tasks included in this unit, followed by solidifying notes and practice activities, will guarantee that students understand the concepts. This unit covers:
- Displaying one-variable data in a histogram, dot plot, or box plot
- Describing the distribution of data using statistical vocabulary
- Using data models and stati
Subjects:
Grades:
8th - 10th
Types:
CCSS:
Showing 1-24 of 429 results

