TPT
Total:
$0.00

Home Prices: High School Statistics Project

Rated 4.67 out of 5, based on 9 reviews
4.7 (9 ratings)
;
Teaching for Understanding
90 Followers
Grade Levels
9th - 12th
Resource Type
Standards
Formats Included
  • Word Document File
Pages
7 pages
$2.50
$2.50
Share this resource
Report this resource to TPT
Teaching for Understanding
90 Followers

What educators are saying

I used this in my senior math class. Most of them took the class to avoid stats and pre-Calc. This will give them a bit of what they can use in the real world!

Description

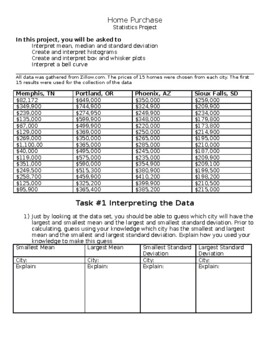
This statistics project has students exploring home prices and using their knowledge of mean, median, standard deviation, histograms, box and whisker plots, and bell curves to make predictions and inferences about the data. This project is provided in a word document to allow the teacher the ability to edit the document or load it to a google doc.

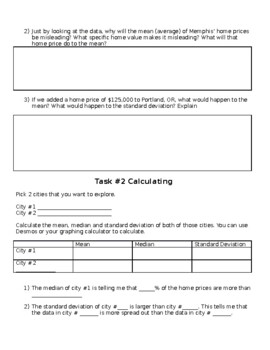
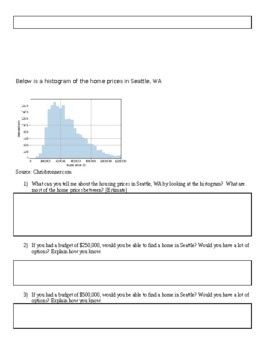
In this project students first make predictions about measures of spread and central tendency without calculating but by looking at the data. Students then calculate standard deviation, mean and median and make statements about the data using these measures. Students then create histograms and box and whisker plots and interpret a provided histogram and box and whisker plot. Lastly, students use a provided bell curve to make statements about the data.

This project does require a teacher to provide instruction prior to the project.

Answer Key Link is provided at the end of the document

Total Pages
7 pages
Answer Key
Included
Teaching Duration
90 minutes
Report this resource to TPT
Reported resources will be reviewed by our team. Report this resource to let us know if this resource violates TPT’s content guidelines.

Standards

to see state-specific standards (only available in the US).
Represent data with plots on the real number line (dot plots, histograms, and box plots).
Use statistics appropriate to the shape of the data distribution to compare center (median, mean) and spread (interquartile range, standard deviation) of two or more different data sets.
Interpret differences in shape, center, and spread in the context of the data sets, accounting for possible effects of extreme data points (outliers).

Reviews

Questions & Answers