86 results
6th grade Common Core HSS-ID.A.3 resources
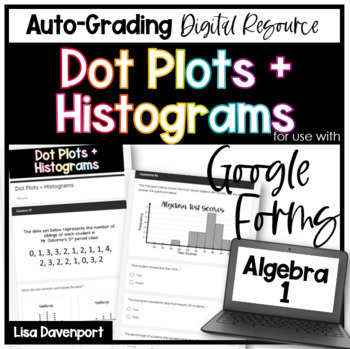
Dot Plots and Histograms Google Forms Homework
This 20-question, auto-grading Google Forms assignment provides students with practice constructing and analyzing data displayed in a dot plot or a histogram.Please note:Questions include a variety of types: "multiple-choice", "short response", "drop down", "select all that apply".Background knowledge includes mean, median, mode, range, and calculating percentages.This download also includes a PDF "worksheet" with the exact same questions as the Google Form. Just assign digitally or print + go!T
Grades:
6th - 9th
Types:
CCSS:
Also included in: Algebra 1 Google Forms Semester 2 Digital and Printable Homework Bundle

Oscar Winner -- Data Analysis & Statistics Inquiry - 21st Century Math Project
Utilize the last twenty years of Oscar winners as a data set to guide your students through creating box and whisker plots, histograms, and exploring mean, median, and mode -- in one 21st Century Math Project!Does the age of the award winning star in a film relate to the overall gross of the movie? Student will explore this inquiry question and use the data to support their conclusion.In this 8 page document you will be given a mapping to the Content Standards, an outline for how to implement t
Subjects:
Grades:
6th - 12th
Types:
Statistics Project - Statistics Olympics
Engage your students in their study of statistics as they compete in self-created Olympic style events. This project will engage students and help them discover meaning and apply concepts including measures of central tendency, quartiles, outliers, variance, standard deviation, z-scores, box plots, histograms, normal and skewed distributions. This project can be completed in approximately 6-8 days (50-min class periods) ** March 2023 Update **Visual updates to all slides and documentsRubric ali
Subjects:
Grades:
6th - 12th
CCSS:
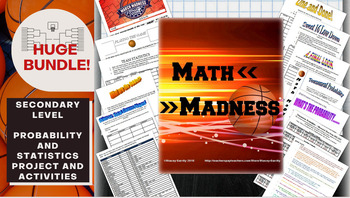
Math March Madness Full Tournament Project {BUNDLE}
Harness the excitement of NCAA March Madness with this huge project for secondary math teachers that follows all stages of the tournament! This Common Core aligned bundle comes with bonus parts not sold individually in my store so you can create a rich immersion in the tournament, practice probability and statistics and learn some interesting new ones along the way! Save $3 plus get bonus content by bundling!You can pick and choose which parts you would like to incorporate, or follow my schedu
Subjects:
Grades:
6th - 12th, Higher Education
Types:
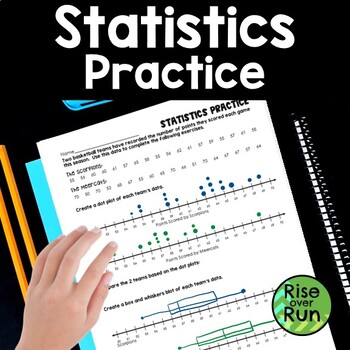
Box and Whiskers and Dot Plot Practice
Practice creating dot plots and box & whiskers plots with this statistics activity.Students are given scores for 2 basketball teams. They use the data to create a dot plot (or line plot) for each team and then a box and whiskers diagram for each team.Then, they compare the data of the teams.A bonus question asks students to calculate the mean absolute deviation.This worksheet can lead to great discussions about how to analyze box and whisker diagrams and make comparisons!
Subjects:
Grades:
6th - 7th
Types:
CCSS:
Also included in: Algebra 1 and 8th Grade Math Curriculum Bundle for Entire Year

Dot Plots, Histograms, and Box Plots Quiz for Google Forms™ - 6.SP.4
About This Resource:This is a Google Forms Quiz on creating and interpreting dot plots, histograms, and box plots. The instructions are easy to follow for you to make a copy of the quiz to your Google Drive. Then you can assign to your students using Google Classroom or some other method.Questions on this assessment were carefully created to give our students the best practice on the following standard.6.SP.4 - Display numerical data in plots on a number line, including dot plots, histograms, an
Subjects:
Grades:
6th - 10th
Types:
CCSS:
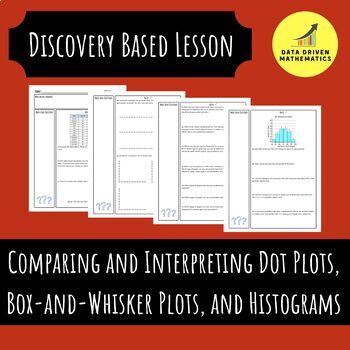
Comparing and Interpreting Dot Plots, Box-and-Whisker Plots, and Histograms
About This Resource:A four page packet containing an investigation into comparing and interpreting dot plots, box-and-whisker plots, and histograms. In addition, you will receive the answer key to help with the implementation of this activity in your classroom. The worksheet flows perfectly and could be used in more of a discovery format or a instructor guided notes.What's Included:You will receive a zipped folder. Inside the zipped folder is a worksheet and the answer key in PDF format.Similar
Subjects:
Grades:
6th - 10th
CCSS:
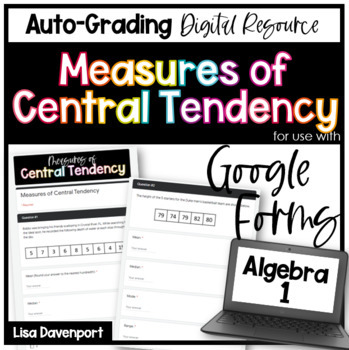
Measures of Central Tendency Google Forms Homework
This 8-question (26- part), auto-grading Google Forms assignment provides students with practice calculating and analyzing measures of central tendency. Questions are organized in the following way:#1-5: Calculate/ Find the mean, median, mode, and range.#6-7: Solve for a missing data value, when the mean is given.#8: Interpret the "best" measure of center (mean or median) and justify your answer.Most questions are "short-response" with a few "select all that apply".This download also includes a
Grades:
6th - 9th
Types:
CCSS:
Also included in: Algebra 1 Google Forms Semester 2 Digital and Printable Homework Bundle
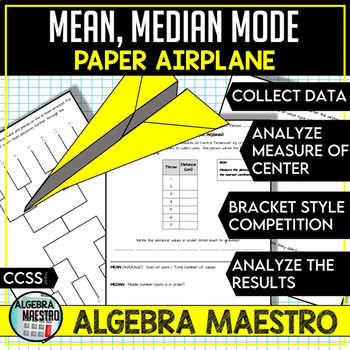
Measure of Center: Paper Airplane Activity
Students can further explore the meaning of statistical measures of center: mean, median, and mode by experimentation. This is a fun activity to explore measures of center. I use this activity with my Algebra 1 students when we start our descriptive data unit before we start talking about graphical displays (i.e. box plots, histograms, etc.). We compare measures of centers and analyze when it is appropriate to use a specific measure.Included:1. Collect data from Paper Airplane 2. Bracket t
Subjects:
Grades:
5th - 11th
Types:
CCSS:
Gridiron Glory -- "Big Game" Data & Paper Football - 21st Century Math Project
I have heard that Americans like Football. I have also heard about an important game that happens in February. I have heard that it's a day that nachos dread. In this 21st Century Math Project, students will complete a variety Football-based assignments related to the Statistics strands of the Common Core. The project caps off with a Paper Football tournament that asks students to use expected value to guide their decisions!This product includes 3 prep assignments that reaches a variety of learn
Subjects:
Grades:
6th - 12th
Types:
CCSS:
Also included in: Probability & Expected Value Unit Bundle - Distance Learning Compatible
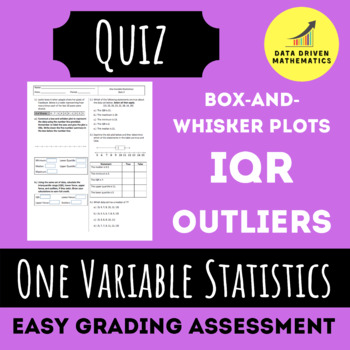
One Variable Statistics Quiz 2 (Box-and-Whisker Plots, IQR, and Outliers)
About This Resource:With this purchase you will receive the second quiz of my One Variable Statistics Unit. This quiz covers box-and-whisker plots, the interquartile range, and identifying outliers. Your purchase will also include the answer key.The questions are meant to prep our students for the Smarter Balanced Assessment (SBAC testing) with a variety of different question formats you might find on the state assessment.What's Included:You will receive a zipped folder. Inside the zipped folder
Subjects:
Grades:
6th - 10th
Types:
CCSS:

Statistics Survey Project - Project Based Learning (PBL) with Math
Watch your students dive into the world of math as they create, execute, and analyze their own survey! Students will demonstrate mastery of data gathering, survey sampling, developing appropriate survey questions, data tables, Direct Variation, discrete graphs, dot plots, box and whisker graphs, and calculating the inter-quartile range.The Unique Survey Project is highly engaging, capitalizing on the innate curiosity of the adolescent mind. You will love the low-prep instructional guide. Your st
Subjects:
Grades:
6th - 10th
Types:
Also included in: Fun with Ratios Activities Bundle - 7th Grade PBL with Math

Stock Market Game - Stock Market Simulation Game for Middle and High School
THE STOCK MARKET GAME! Create a virtual Stock Exchange in your own classroom and allow students to experience the basics of investing!In The Stock Market Game, students are introduced to the foundations of investing and how the stock market actually works. Open their eyes to new possibilities and teach them a tool they can use to improve their financial future! (While implementing essential math standards, of course!)The Stock Market Game includes everything you need set the stage and experience
Subjects:
Grades:
6th - 12th
CCSS:
Measures of Center & Variance Unit Bundle - Distance Learning Compatible
This is a selection of my Measures of Center & Variance resources all in a money saving Essential Bundle! You save significant money and time versus purchasing these separately!Essential Bundles are designed to give you everything you need to rock your unit. Warmups, Notes, Activities, Games, Exit Tickets, and Tests. You will find a selection of my Drive Instruction, Escapes, Boot Camp, Adventures, Whodunnits, CSI, Person Puzzles, STEM-ersions, Herowork, TableTop and my 21st Century Math Pro
Subjects:
Grades:
6th - 12th
Types:
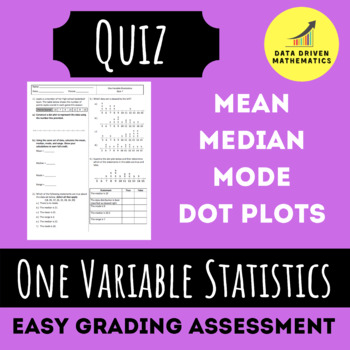
One Variable Statistics Quiz 1 (Dot Plots, Mean, Median, Mode, Range)
About This Resource:With this purchase you will receive the first quiz of my One Variable Statistics Unit. This quiz covers dot plots, mean, median, mode, and range. Your purchase will also include the answer key. The questions are meant to prep our students for the Smarter Balanced Assessment (SBAC testing) with a variety of different question formats you might find on the state assessment.What's Included:You will receive a zipped folder. Inside the zipped folder you will find each of the follo
Subjects:
Grades:
6th - 10th
Types:
CCSS:
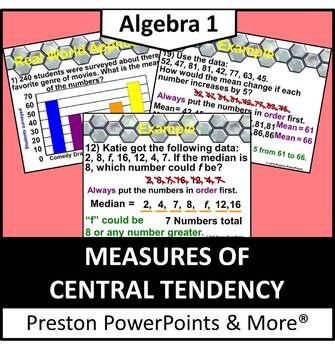
(Alg 1) Measures of Central Tendency in a PowerPoint Presentation
Algebra 1 Measures of Central Tendency in a PowerPoint PresentationThis slideshow lesson is very animated with a flow-through technique. I developed the lesson for my Algebra 1 class, but it can also be used for upper level class reviews. This lesson teaches how to find the mean, median, and mode of a data set, identify and remove outliers, explain the effects of changing values in data sets, and solve real-life data problems using graphs to organize as the most liked movie genre.This lesson h
Grades:
5th - 9th
CCSS:
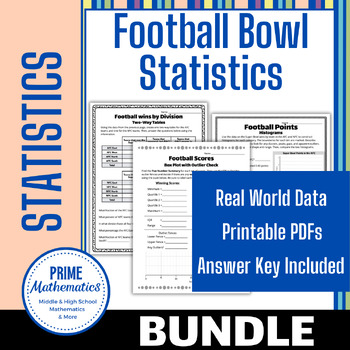
Football Bowl Statistics Super Bundle
Use statistics from previous football championships to practice finding measures of central tendency and variability and creating charts such as box-and-whisker plots, dot plots, and histograms. The students will look at football championship wins and scores. This is a super way to engage sports fans in math.The following topics are covered:Mean, Median, & ModeFive-number summaryIQR & RangeBox plots (with or without checking for outliers)Mean absolute deviationStandard deviationHistogram
Subjects:
Grades:
6th - 12th
Types:

The Great Stock Market Challenge - Complete Math Unit
Suitable and adapted for grades 5-12Open the Preview to see more detailed informationWatch the movie to see a high speed play through of the presentationThis complete cross-curricular unit has students learn about companies, research stocks, create a portfolio, track their performance, submit their project and write a test. Students will learn about real life financial literacy, trade-offs, decision making, strategies, and apply mathematical concepts.The unit runs about 10-14 weeks long, with an
Subjects:
Grades:
5th - 12th
Types:
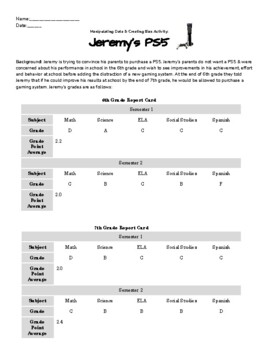
Manipulating Data & Creating Bias Activity
Manipulating Data & Creating Bias Activity: Teach your students about how charts and statistics can be skewed; and real numbers can reflect bias with this fun project! Students are given a role (either Jeremy or his parents) and have to use two pieces of data from Jeremy's 6th & 7th grade report card to argue for or against his deserving of a PS5!Students get to be creative & make cross-curricular connections to ELA as they use logical fallacies & skewed graphs to make their argu
Subjects:
Grades:
4th - 11th
Types:
CCSS:
NGSS:
HS-ETS1-4

Energy Drinks and Sodas Statistics Bundle
Use statistics about energy drinks and sodas (sugar and caffeine content) to practice finding measures of central tendency and variability and creating charts such as box-and-whisker plots, dot plots, and histograms. The students will compare the amount of sugar and caffeine in energy drinks and sodas.The following topics are covered:Mean, Median, & ModeFive-number summaryIQR & RangeBox plots (with or without checking for outliers)Mean absolute deviationStandard deviationHistogramDot Plo
Subjects:
Grades:
6th - 12th
Types:
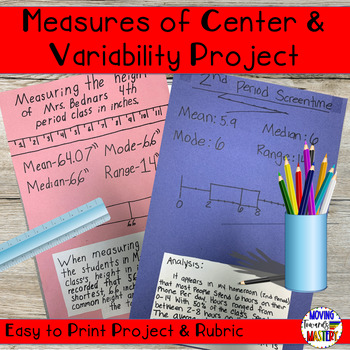
Measures of Center & Measures of Variability Math Project
Project for measures of center & measures of variability for middle school or high school math. Students will gather data and calculate mean, median, mode, ranges, & quartiles. Students will create a box & whisker plot and analyze the data collected.Measures of Center & Variability Project includes:♦ Suggested Lesson Plans♦ Suggested Topics of Interest♦ Student Directions & Project Plan♦ Student Recording Sheets→ Data Collection→ Organized Sheet to Show Calculations→ Sheet fo
Subjects:
Grades:
6th - 9th
Types:
Also included in: Middle School Math Projects for End of the Year Activities
Distribution of Data Quiz for Google Forms™ - 6.SP.2 - Distance Learning
About This Resource:This is a Google Forms Quiz on the distribution of data. The instructions are easy to follow for you to make a copy of the quiz to your Google Drive. Then you can assign to your students using Google Classroom or some other method.Questions on this assessment were carefully created to give our students the best practice on the following standard.6.SP.2 - Understand that a set of data collected to answer a statistical question has a distribution which can be described by its c
Subjects:
Grades:
6th - 10th
Types:
CCSS:
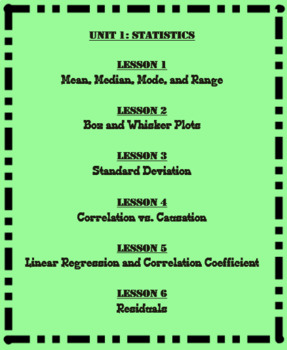
Unit 1-Statistics (Math 1)
This is the first Unit of the eight Units that I cover in Math 1. This unit is broken up in to six different lessons that are listed below. Each lesson includes a SMART Notebook presentation, a student note-taking guide, and an answer key. Also included in this unit are student flashcards, a test outline, and a 25 question multiple choice test.
Unit 1: Statistics
Lesson 1: Mean Median Mode Range Outliers and Skew
Lesson 2: Box and Whisker Plots
Lesson 3: Standard Deviation
Lesson 4: Correlati
Subjects:
Grades:
6th - 12th
CCSS:
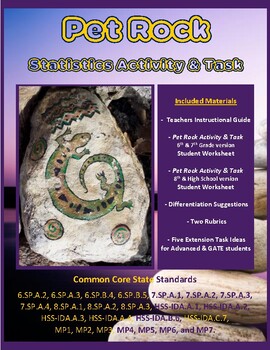
Pet Rock Statistics Activity & Task - Project Based Learning (PBL) with Math
Statistics come alive with this differentiated, student-led activity! The Pet Rock Activity & Task gives students an opportunity to gather, organize, and analyze random data. Students get creative while personalizing their own Pet Rock. Data from individual rocks is then measure, shared, compiled, analyzed, graphed, and displayed. Students will:Create a pet in the Pet Rock Activity.Use precision to weigh the rocks and record the data.Construct a graphical display of the data.Calculate numeri
Subjects:
Grades:
6th - 10th
Types:
Showing 1-24 of 86 results

