32 results
Adult education Common Core HSS-ID.A.3 resources
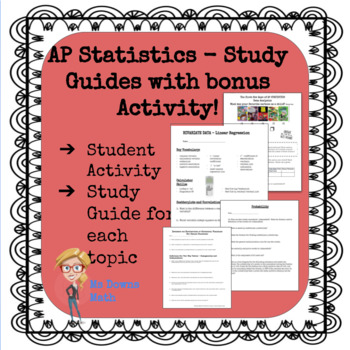
AP Statistics Study Guides - All Topics!
There is a pdf file study guide for each topic in the AP Statistics curriculum. Exploring Data, Normal Distributions, Linear Regressions, Experiments and Designing Studies, Probability, Random Variables, Sampling Distributions, Confidence Intervals, Hypothesis Tests, Comparing Populations, Chi Square Procedures, and Inference about Regression. I have students complete one for each unit. At the end of the year, they have a great study packet for the AP Exam! Student feedback has indicated that th
Subjects:
Grades:
9th - 12th, Higher Education, Adult Education
Types:
CCSS:
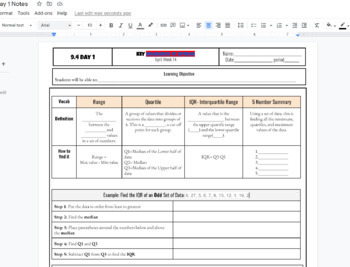
IQR interquartile Range and 5 number summary box and whisker plot Notes
IQR interquartile Range and 5 number summary box and whisker plot Notes including Q1, Q2, Q3, Min and Max and step by step both examples of finding the IQR and creating a box and whisker plot. Used in HS math 1 class WITH KEY INCLUDED AS a link to a printable PDF
Subjects:
Grades:
7th - 12th, Higher Education, Adult Education
CCSS:
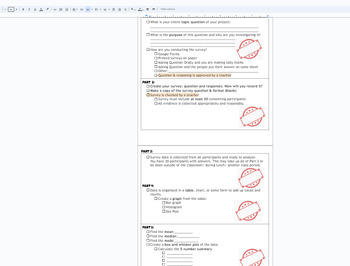
Statistics Survey project Discovery (broken down into sections) with Rubric
This is a broken down (scaffolded) packet of instructions/ guide for a Stats Project for Math 1 HS or 8th grade students. The goal of the project is for students to take a statistical survey on quantitative data (numbers) of their choice. Using this data from the survey, the following will be included in the project:Survey- the question being askedSurvey responses (requirement of 30)Data organization: Bar chart, Histogram, Dot PlotMeanMedianModeBox and Whisket Plot5 number summary (Q1,Q2,Q3, min
Subjects:
Grades:
7th - 12th, Higher Education, Adult Education
CCSS:
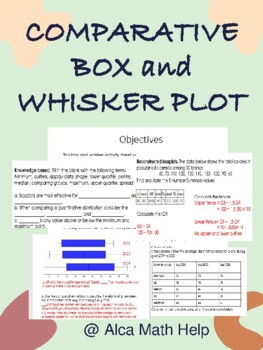
Comparison Box and Whisker Plots Worksheet, Quiz, Test for Stats & AP Stats
This box and whisker activity sheet was designed to test students understanding of the 5 number summary data values given quantitative data sets. Perfect for students in grade 10-12 doing statistics and you want to give them a challenge and should be manageable for students doing AP STATSAt the end of this activity students should be able to1. Students should be able to explain and construct box plots showing the different regions and what they represent. 2. Students should also be able to use
Subjects:
Grades:
11th - 12th, Higher Education, Adult Education, Staff
CCSS:
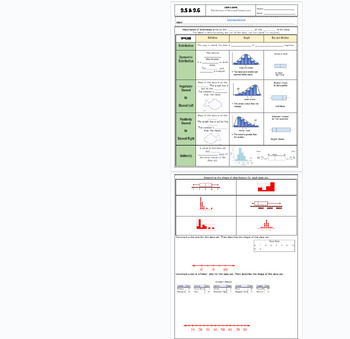
Data Distribution positive/negative skewed fillable notes UPDATED
Unit 9: Data and Stats: Updated(No 9.3/ Skip)9.5/9.6 Data Distribution (skewness)Students go over the vocabulary and complete the examples with the vocabulary scaffolded. Skewness is explained and how to identify it comparing data charts and box and whisker plots. Uses many visuals and examples to differentiate between that different graphs. Notes are scaffolded. Includes hook video hyperlinked on the "learning objective" title. Key is included and hyperlinked as a PDF in the heading highlighted
Subjects:
Grades:
6th - 12th, Higher Education, Adult Education
CCSS:
Also included in: Unit 9: Data and Statistics Fillable Notes

Unit 9: Data and Statistics Fillable Notes
Unit 9: Data and Stats(No 9.3/ Skip)9.1 Central Tendencies: Mean, Median and Mode9.2 Graphical Data: Bar Charts, Dot Plots and Histograms9.3 NONE9.4A 5 number summary and box and whisker plots 9.4B Standard Deviation9.5/9.6 Data Distributions (skewness) left or right9.7 Frequency Tables and relative frequency tablesStudents go over the vocabulary and complete the examples with the vocabulary scaffolded. Notes are scaffolded. Includes hook video hyperlinked on the "learning objective" title. Key
Subjects:
Grades:
6th - 12th, Higher Education, Adult Education
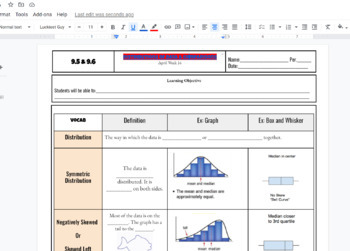
Distributions of Data Scaffolded Fillable Notes (Skewed Left & right) w/ KEY
Distributions of Data Scaffolded Fillable Notes (Skewed Left & right) Includes a problem of creating box plot, bar chart, and dot plot. KEY IS INCLUDED linked at top of title highlighted in red!!! , Algebra 1 or Math 1 class in highschool setting IEP 504 EL learners visuals for better understanding. YOU CAN EDIT THE GOOGLE DOC to your liking!!!
Subjects:
Grades:
7th - 12th, Higher Education, Adult Education
CCSS:
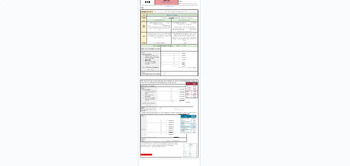
Standard Deviation Fillable Notes UPDATED
Unit 9: Data and Stats: Updated(No 9.3/ Skip)9.4 B Standard DeviationStudents go over the vocabulary and complete the examples with the vocabulary scaffolded. Standard deviation is long hand calculated by showing each step of the process (difference of squares). Real-world examples are explained in notes before calculating to show the importance of this stat and why it is used so often to verify valuable and effective data. Notes are scaffolded. Includes hook video hyperlinked on the "learning o
Subjects:
Grades:
7th - 12th, Higher Education, Adult Education
CCSS:
Also included in: Unit 9: Data and Statistics Fillable Notes
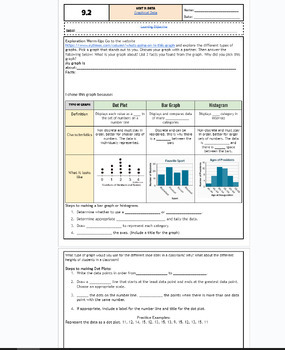
Graphical Data: Bar Charts, Dot Plots and Histograms fillable notes UPDTD
Unit 9: Data and Stats: UpdatedUpdated9.2 Graphs: bar, dot plot, histpgramStudents go over the vocabulary and define each type fo graph and what data fits for each graph. The warm up is an exploratory activity where students go on a website to search for their graph of interest and discuss the key findings. This takes around 10-15 mins and students enjoyed it! Notes are scaffolded. Includes hook video hyperlinked on the "learning objective" title. Key is included and hyperlinked as a PDF in the
Subjects:
Grades:
6th - 12th, Higher Education, Adult Education
CCSS:
Also included in: Unit 9: Data and Statistics Fillable Notes
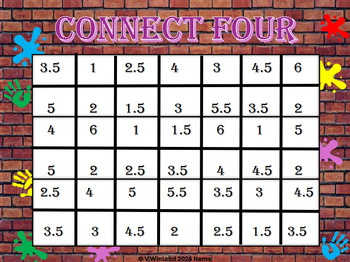
Connect Four ( Statistics)
Statistics Connect FourConnect four by rolling dice and finding averages.Students have to keep track of frequency and relative frequency.Also create a histogram and decide if frequencies create a uniform, normal curve or skewed curve.
Subjects:
Grades:
10th - 12th, Higher Education, Adult Education
Types:
CCSS:

6 Editable Bar Graph Templates 2.0
Finally a simple and professional graph space that students can fill out without any design issues getting in the way. This file contains 6 ready-to-use graph options. Print them and have students fill them with pencil and ruler, or distribute them over computer and let them practice entering the data. Get a project perfect finish every time. Maybe you just want to fill it out live on a projector? The possibilities are endless! It's okay to say you love these bar graphs. So do we.Contains:- 2 bl
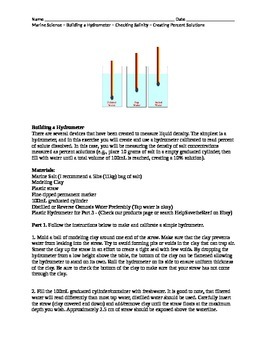
Marine Science Biology Making a Hydrometer Making Percent Solutions
This laboratory experience enables students to create a hydrometer using clay and straws to measure unknown solutions. Students begin by calibrating their devices using percent solutions that they must make. They can then use their device to measure unknown solutions provided by the instructor. Students are asked to convert units of measure. Additional research questions are provided that go beyond the laboratory activity.
Subjects:
Grades:
9th - 12th, Adult Education
Types:
CCSS:
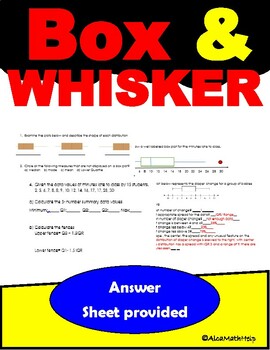
Statistics Quantitative Data Boxplots- 5 Number Summary Data CP, AP Stats
If you are looking for an activity sheet that will engage students as they aim to practice and apply taught concept this box plot activity is the one. It is excellent if you want to check students understanding while having fun. This activity helps students to describe the shape of quantitative distribution, identify centers and spreads by analyzing quartiles (measure of center and variability) . Use the SOCS method to describe the shape, center, spread and outlier as well as other unusual feat
Subjects:
Grades:
7th - 12th, Higher Education, Adult Education
Types:
CCSS:
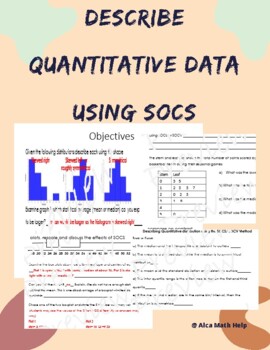
Describe Quantitative Data using SOCS/SOCV- Box plot, Histogram, Stem plot
If you are looking for a worksheet that can be used as a quiz, test, review packet you are at the right place. This activity sheet is suitable for students doing AP Stats and CP Probability and Statistics. This activity sheet allows students to:Use prior knowledge to answer true false questions and fill in the blanks with vocabulary provided.Describe box plots, histogram and stem plot using SOCS.Interpret the shape, center, outlier or any unusual feature along with the spread.
Subjects:
Grades:
11th - 12th, Higher Education, Adult Education, Staff
CCSS:
Graphic Organizers for Statistics 1 - Descriptive Statistics
These organizers, which are designed for the first part of a High School or Freshman College level course, delve into the concepts taught about Descriptive Statistics. This resource includes 15 blank organizers, 15 filled-in organizers (keys), notes about each organizers, and templates for making pie charts, bar charts, and scatterplots.
Subjects:
Grades:
11th - 12th, Higher Education, Adult Education
Types:
CCSS:
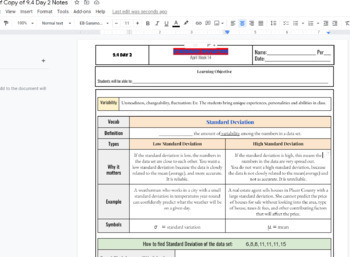
Standard Deviation Scaffolded Fillable Notes AND key
Standard Deviation Scaffolded Fillable Notes AND key, give definitions to the terms with real-world examples! Includes a video link in the notes as the intro to the lesson by describing the meaning and need for standard deviation in the simplest form possible! The key is linked at the top of notes as well that will download as a pdf- not a google doc- did not do the last problem on the bottom as it was an exit ticket for students (no layout).
Subjects:
Grades:
7th - 12th, Higher Education, Adult Education
CCSS:
Algebra 1 - Common Core Practice Final Exam - Google Form #1 (45 Questions)
Hello! The purchase of this product grants the purchase of one (1) DIGITAL (Google Forms) self-grading assessments, which is a practice final exam that has a mix of forty-five (45) multiple-choice & fill-in-the-blank questions on Algebra 1 - 1st Semester Common Core Curriculum.Goals Of This Assessment: Students will be able to:Simplify or identify equivalent algebraic expressions. Represent math relationships using symbolic algebra. Differentiate between linear and nonlinear functions. Model
Subjects:
Grades:
6th - 12th, Higher Education, Adult Education
Types:
CCSS:
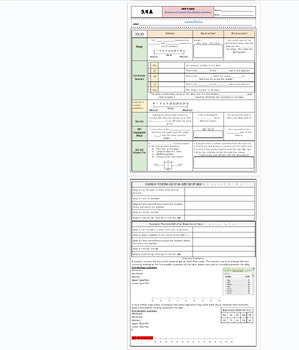
5 Number Summary and Box and Whisker Plots Fillable Notes UPDATED
Unit 9: Data and Stats: Updated(No 9.3/ Skip)9.4 A 5-number summary and box and whisker plot Students go over the vocabulary ad complete the examples with the vocabulary scaffolded. for each statistic with an explanation of the purpose of the 5 number summary and why these are used. Notes are scaffolded. Includes hook video hyperlinked on the "learning objective" title. Key is included and hyperlinked as a PDF in the heading highlighted in the orange box, and at the bottom of the google doc as w
Subjects:
Grades:
6th - 12th, Higher Education, Adult Education
CCSS:
Also included in: Unit 9: Data and Statistics Fillable Notes
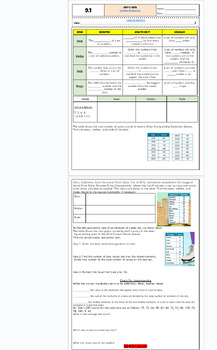
Central Tendencies: Mean, Median and Mode fillable notes: Updated
Unit 9: Data and Stats Updated9.1 Central Tendencies: mean median and modeStudents go over the vocabulary and how to find each average with examples. Notes are scaffolded. Includes hook video hyperlinked on the "learning objective" title. Key is included and hyperlinked as a PDF in the heading highlighted in the orange box, and at the bottom of the google doc as well. Google doc is editable, used in M1 HS
Subjects:
Grades:
6th - 12th, Higher Education, Adult Education
CCSS:
Also included in: Unit 9: Data and Statistics Fillable Notes
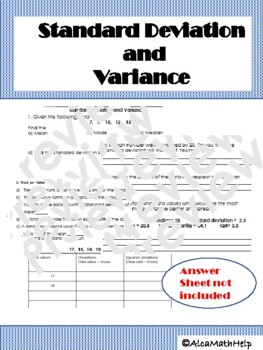
Standard Deviation and Variance AP Stats, CP probability and Statistics
If you are looking for an activity sheet that will help students to practice standard deviation and variance both by hand and the table. This is the activity you are looking for. Not too complex but requires some level of thinking.Objectives:1. Students should be able to interpret the relationship between the mean and standard deviation. 2. Students should know how the change in variables affects the spread and center. 3.Students will be able to complete a knowledge-based section by answering tr
Subjects:
Grades:
10th - 12th, Higher Education, Adult Education, Staff
CCSS:
People Perfectly in Proportion: The Golden Ratio
Zip File includes - PDF and editable documentLesson Setup: This lesson can be used for students at all developmental levels. Measuring with a ruler, error analysis, and proportional thinking are a few of the skills this lesson practices. Groups can be made based upon skill requirements. Lower functioning students can perform measurements and watch higher performing students do calculations. Result could also be presented by a possible third student - if you want to do trios as opposed to pa
Subjects:
Grades:
3rd - 12th, Adult Education
Types:
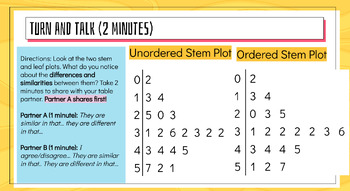
Distributions Lesson: Describe and compare distributions, dot plots, stem plots
This is a lesson (on powerpoint) about statistical distributions. The lesson includes practice problems and vocabulary relating to dot plots, stem plots, and describing/comparing statistical distributions. This is for secondary math (high schoolers). It includes some data collection activities and requires students to get involved in the lesson. If you teach with a tablet, iPad, or smart board, this template is writing-friendly. You can write on the presentation or edit it as you need for your c
Subjects:
Grades:
8th - 12th, Adult Education
Types:
CCSS:
Margin of Error Notes and Practice
Teach your students about Margin of Error with these scaffolded notes and practice problems. This Product Includes:NotesPractice problemsAnswer Key
Subjects:
Grades:
8th - 12th, Higher Education, Adult Education
CCSS:
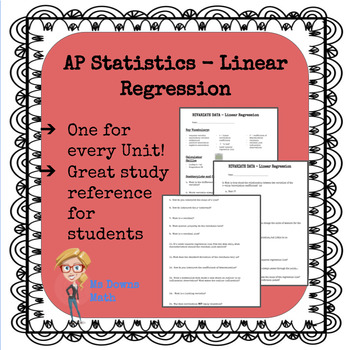
AP Statistics Linear Regression Study Guide
At the beginning of each unit, I give my students a study guide that is due the day of the unit test. These guides are a good way to prepare for the unit as we go. At the end of the year students have a nice reference book for the whole course!
Subjects:
Grades:
9th - 12th, Higher Education, Adult Education
Types:
CCSS:
Also included in: AP Statistics Study Guides - All Topics!
Showing 1-24 of 32 results

