Goldie's AP® Statistics Semester 1 Multiple Choice Questions Bundle
- Zip
What educators are saying
Products in this Bundle (4)
Description
AP® Statistics
Semester 1 (Units 1 - 4)
Multiple Choice Questions (MCQ) Practice
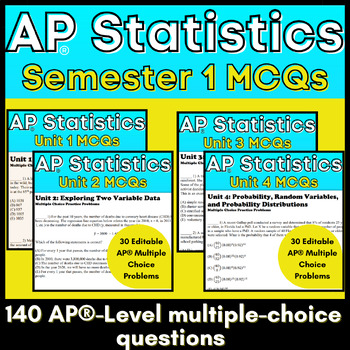
This is a resource that has 140 AP-level multiple-choice questions. You will receive the editable Word document for this resource, making it easy to modify and copy these questions in your classroom. You will also receive the PDF version for easy formatting. The answer key for this resource is included.
These are BRAND NEW AP questions that I have developed for AP Statistics. These questions are not used anywhere else in my resources; they are unique to this resource alone.
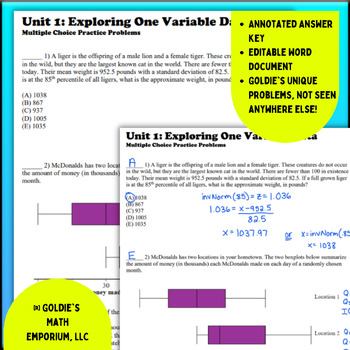
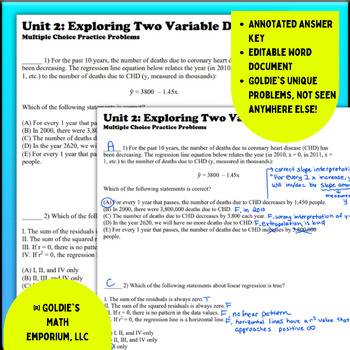
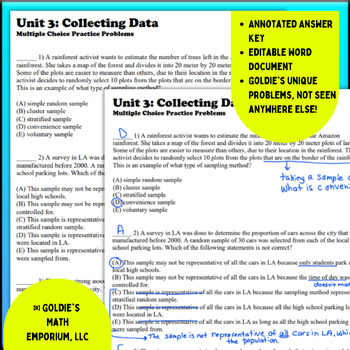
*NEW* Annotated answer keys are now provided! You can see how I got each answer to the MCQs, with worked-out solutions.
Ideas for using this resource:
✅ Extra practice problems within the unit
✅ Final exam practice problems or problems to put on a final exam
✅ AP exam practice problems to help prepare students for the AP exam right before the exam
***************************************************************************************
If you like this resource, you might also be interested in:
Goldie's FULL CURRICULUM for AP® Statistics
Goldie's Homework Bundle for AP® Statistics
Goldie's Assessment Bundle for AP® Statistics
Goldie's Guided Note Bundle for AP® Statistics
Goldie's Project and Activities for AP® Statistics
***************************************************************************************
Here are the individual multiple-choice questions INCLUDED in this resource:
Unit 1 Exploring One Variable Statistics MCQ
Unit 2 Exploring Two Variable Statistics MCQ
Unit 4 Probability, Random Variables, and Probability Distributions MCQ
If you are interested in my second-semester multiple-choice questions, check out the resources below:
Goldie's AP® Statistics Semester 2 Multiple Choice Questions Bundle
- Unit 5 Sampling Distributions MCQ
- Unit 6 Inference for Categorical Data: Proportions MCQ
- Unit 7 Inference for Quantitative Data: Means MCQ
- Unit 8 Inference for Categorical Data: Chi-Square MCQ
- Unit 9 Inference for Quantitative Data: Slopes MCQ
***************************************************************************************
If you need extra explanations or additional guidance, I would love to help!! Contact me at goldiesmathemporium[at]gmail.com for any questions or samples.
AP® is a registered trademark of the College Board® which does not endorse this product.
I want to provide the best possible resources to help other teachers out! You will be notified of any future updates and additions to this product and it will be free of charge. Your support is important and I thank you for allowing me to continue doing what I love to do.
© Goldie’s Math Emporium, LLC
This work is bound by copyright laws and editing (beyond your own classroom use), selling, redistributing, or posting all or part of these documents on the Internet is strictly prohibited. Violations are subject to the Digital Millennium Copyright Act.


