157 results
12th grade statistics centers
Deal or No Deal Probability Game for Grades 6 and up
Play a game while learning---what more can a student want? Introduce this take on a popular television game show, Deal or No Deal, to get your students engaged in the study of probability. This pack includes:Directions for contestant/bankerGame sheets for contestant/bankerBrief cases 1-25 (laminate these for durability)Brief cases for $.01-$1,000,000 (laminate these for durability)You may also want to put velcro on the back to make it easier to play and switch cases!Leave feedback and comments
Subjects:
Grades:
6th - 12th
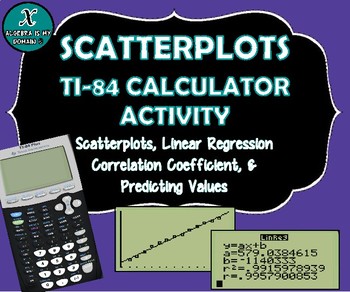
TI-84 CALCULATOR ACTIVITY - Data, Scatterplots, Regression & Line of Best Fit
This file includes four linear regression examples (all real-life data). The examples cover the following topics for the TI-84 graphing calculator:
* Creating a scatterplot
* Performing linear regression (finding the equation of the best-fit line)
* Interpreting the slope of the equation
* Calculating and interpreting the correlation coefficient
* Predicting values (using the linear regression equation)
The first example gives the step-by-step instructions to calculate all the necessary value
Subjects:
Grades:
7th - 12th, Higher Education
Types:
CCSS:
Conditional Probability Two-Way Frequency Tables Scavenger Hunt Activity
Conditional Probability Two-Way Frequency Tables Scavenger Hunt Activity
During this activity, students travel around the room answering conditional probability questions involving two-way frequency tables.
This activity is a great opportunity to group students or let students work with a partner. Students begin by starting at a random station. After a student has found the answer to a station, he will visit the next station using the answer he found. Students continue to move at their own pa
Subjects:
Grades:
6th - 12th
Types:
CCSS:
Set Theory with Venn Diagrams Task Cards Activity (And, Or, and Complement)
Set Theory Task Cards (Using And, Or, and Complement)
These 10 task cards are a fun way for students to practice identifying sets using AND, OR, and COMPLEMENT.
The task cards present sets in a variety of ways. Some cards include lists of numbers, while others include tables or lists of names. For each card, students must create a Venn diagram and answer 1 to 4 questions about the set. The cards get increasingly more difficult as students progress through the 10 cards.
These are the types o
Subjects:
Grades:
6th - 12th
Types:
CCSS:
BACK TO SCHOOL STEM ACTIVITY: Spaghetti Marshmallow Challenge
Don't miss out on this wonderful opportunity for your students to work collaboratively, problem-solve, show creativity and use their math skills! This Spaghetti Marshmallow Challenge cost me less than $2.00 for all supplies but delivers such a big bang for the buck! Fun for students K-12 (they say that the kindergarteners actually build the highest!). Enjoy!
Subjects:
Grades:
PreK - 12th, Higher Education, Adult Education, Staff
Types:
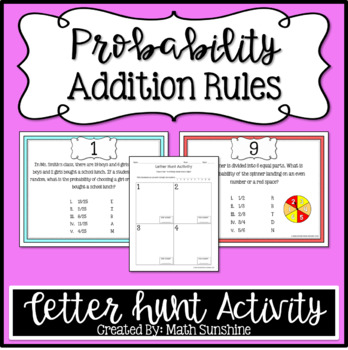
Probability Addition Rules Letter Hunt Activity
Probability Addition Rules Letter Hunt Activity:
This set of 10 stations lets students practice finding probabilities of different events using the Probability Addition Rule. In order to solve the problems, students will need to be able to distinguish between overlapping and mutually exclusive events.
Each station has multiple choice answers. After students have solved a station, they will find their answer on the paper and locate the matching letter. Then they will write the letter at the to
Subjects:
Grades:
6th - 12th
Types:
CCSS:
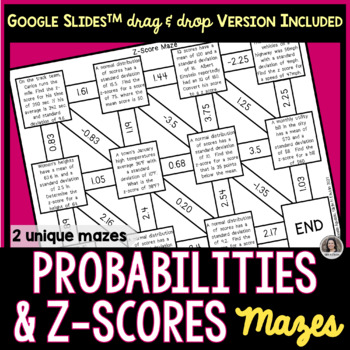
Z Scores and Probabilities of Normal Distributions Mazes Google Slides™ & Print
Make practicing math more fun with these 2 different mazes on finding z-scores and probabilities of normal distributions. For each self correcting maze activity, students will solve at least 9 problems. Types of Mazes*Finding Z-Score from a Word Problem Maze #1*Finding Probabilities or X-Values Given the Z-Score Maze #2Students may complete their work on the provided student response sheet that corresponds to the maze assigned. Note: Not all boxes are used. Included:TWO unique MazesA pdf with a
Subjects:
Grades:
6th - 12th, Higher Education
Types:
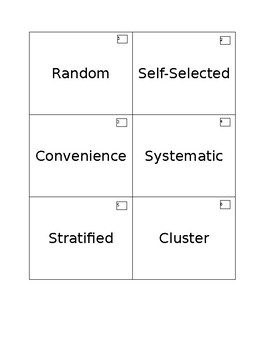
Sampling Methods Matching Activity
18 cards included. Students match six types of sampling methods (random, cluster, stratified, convenience, systematic, and self-selected) with their definitions and an example of each type. Teacher answer key included for easy assessment. When students are finished, they should have 6 groups of 3 cards each for teacher/other group to check.
Subjects:
Grades:
9th - 12th
Types:
CCSS:
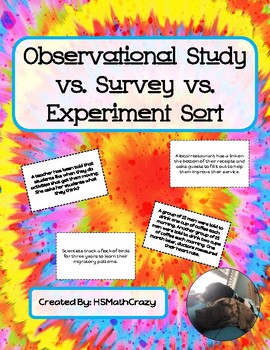
Observational Study vs. Survey vs. Experiment Sort
Students sort 15 scenarios into 3 categories: observational study, survey, and experiments. The then cut out scenario and glue it in the correct area. If you like this activity, please consider following my store and checking out other products. I would love to hear your feed-back in your review.
Subjects:
Grades:
11th - 12th, Higher Education
Types:
Also included in: GSE Algebra 2 Unit 7 Bundle
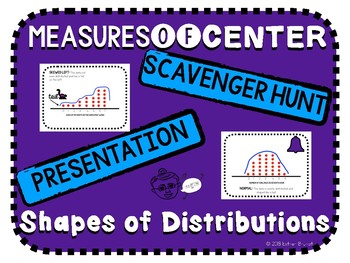
Shapes of Distributions and Measures of Center Scavenger Hunt and Presentation
A note to the teacherThis resource is for teaching shapes of distributions, analyzing the use of the mean versus the median, and deciphering which among the two is higher based on the shape of the distribution.This resource includes:Keynote and Powerpoint Presentation & PDF(Animated)Shapes of DistributionsNormalSkewed LeftSkewed Rigt2 Examples EachWhich Measure of Center is More Appropriate (Mean vs Median)6 Example Knowledge Check Which Measure of Center is Higher (Mean vs Median)?6 Example
Subjects:
Grades:
8th - 12th
Also included in: Math Activity Bundle
Scatter Plot Graph Worksheets
A collection of worksheets to use when teaching how to investigate patterns of association in bivariate data. Product includes 3 posters for students to reference how to determine if data is increasing, decreasing, or has no correlation. Types of worksheets include:
-Determine line of best fit
-Draw and analyze line of best fit
-Analyze scatter plot graph data trends (increasing, decreasing, and no correlation)
-Graph data from a table to create a scatter plot graph and analyze results
-Use reso
Subjects:
Grades:
1st - 12th
Types:
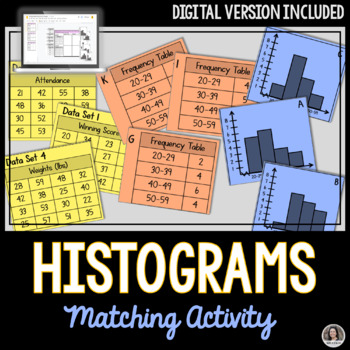
Histograms Matching Activity, Print and Digital Google Slides™
Practice makes perfect! This matching histograms activity is an ideal assignment for students to demonstrate their understanding of Histograms. Students match the data set to their corresponding frequency tables and histogram graphs. There will be 6 matches made when complete. Included:A pdf with a link to make a copy of the Interactive Google Slides™ for your own Google Drive™A printable version for students to sort and match.Student Response SheetAnswer keyDigital Version:Go paperless with thi
Subjects:
Grades:
7th - 12th
Types:
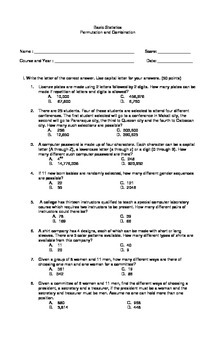
Probability and Statistics Multiple Choice on Permutation and Combination
Grab this Worksheet! a 25 multiple choice questions on probability's Permutation and Combination that will enhance and gain student's understanding on the topic!you can have this as a quiz or as a practice exercises in your class! a must have!!Viva Math!
Subjects:
Grades:
9th - 12th, Higher Education, Adult Education
Types:
Conditional Probability Word Problems Scavenger Hunt Activity
Conditional Probability Word Problems Scavenger Hunt Activity
During this activity, students travel around the room answering 15 conditional probability word problems involving dice, cards, marbles, and other situations.
This activity is a great opportunity to group students or let students work with a partner. Students begin by starting at a random station. After a student has found the answer to a station, he will visit the next station using the answer he found. Students continue to move a
Subjects:
Grades:
6th - 12th
Types:
CCSS:
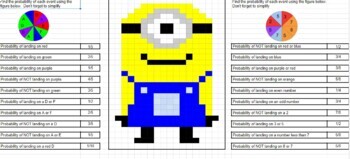
Digital learning Simple Probability Pixel Art (Minions)
This 20 question pixel art activity is designed to help your students master the basic skill of simple probability and it's compliment. Allow the students to have fun with this pixel art activity in which if the student gets the answer correct then parts of the image will appear. If the student is incorrect then no parts of the image will appear.
Subjects:
Grades:
7th - 12th
Types:
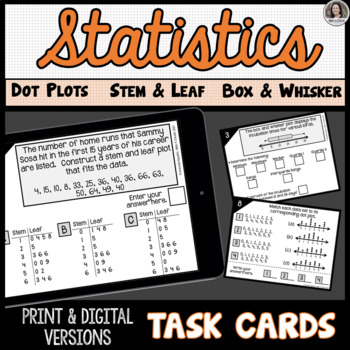
Statistics: Steam and Leaf Plots, Dot Plots, Box and Whisker Plots Task Cards
Students will practice constructing and interpreting stem and leaf plots, dot plots, and box and whisker plots by completing these 16 unique task cards. Students will demonstrate a deep understanding of the various plots by identifying key concepts: Mean, Median, Mode, Range, Interquartile Range, Minimum, Maximum, and/or Quartiles. This activity is an ideal assignment for students to complete at the conclusion of a Statistics unit for review and extra practice.Tasks Include:Construct a stem and
Subjects:
Grades:
6th - 12th, Higher Education
Types:
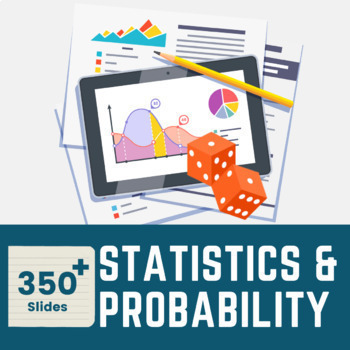
High School Statistics and Probability Bundle
High School Statistics and Probability PacketThis amazing statistics and probability bundle is all you need for your middle school to High school learners. From calculating averages using frequency tables to condition probability, your learners are definitely going to be immersed in their learning! Buy this high-engagement math bundle today and save hours of lesson planning time.Interactive Digital lessons inside this bundle include:Measures of Central tendencyConditional Probability - Venn Diag
Subjects:
Grades:
7th - 12th
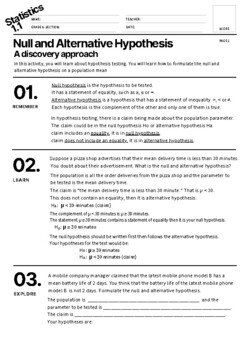
Statistics Null and Alternative Hypothesis Discovery approach
Having difficulty in teaching Null and Alternative Hypothesis?Does your student still confuse how to formulate the null and alternative hypothesis? Grab this Lecture- Activity -Quiz all in one all about how to formulate the null and alternative hypothesis.This includes, all the important points to remember. Easy to understand and student's learn it by discovering the meaning and concept by following this activity all through out.You don't need to teach long and keep on repeating for students who
Subjects:
Grades:
9th - 12th, Higher Education, Adult Education
Types:
Data Analysis Statistics and Probability worksheets (63 Problems) (SAT Review)
Data analysis statistics and probability worksheets ,63 problemsSAT ReviewFraction and Data (29 Multiple choice questions)Statistic Problem (15 questions)Probability Word Problems This section contains 19 word problems about :Simple ProbabilityCounting PrincipleIndependent ProbabilityDependent ProbabilityMutually Exclusive EventsPermutationsCombinationsConditional Probability* AlSO AVAILABLE FOR YOU OR A COLLEAGUE! - CLICK ANY LINK YOU WANT:Number and Operations (SAT Review) Algebra & Functi
Subjects:
Grades:
7th - 12th, Higher Education, Adult Education, Staff
Types:
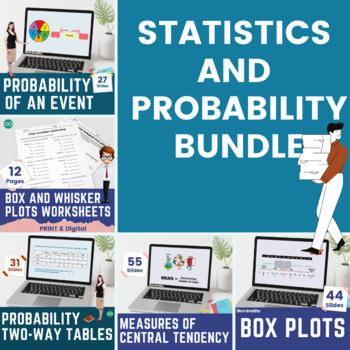
Complete Statistics and Probability Bundle | Digital and Print
This amazing statistics and probability bundle is all you need for your middle school to High school learners. From calculating averages using frequency tables to condition probability, your learners are definitely going to be immersed in their learning! Buy this high-engagement math bundle today and save hours of lesson planning time.Interactive Digital lessons inside this bundle include:Measures of Central tendencyConditional Probability - Venn DiagramsConditional Probability - Two-way tablesP
Subjects:
Grades:
7th - 12th
Types:
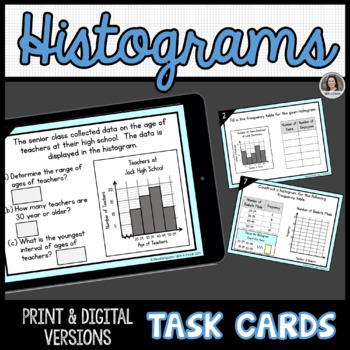
Histograms Task Cards, Print and Digital Google Slides™
Students will practice graphing, reading, and interpreting histograms by completing these 12 unique task cards. Tasks Include:Given a histogram or frequency table, interpret the informationCreate a frequency table for the given histogram.Construct a histogram for a given frequency table or set of data.Determine the class width for a given set of dataConstruct a frequency table for a given set of data.Included:A pdf with a link to make a copy of the Interactive Google Slides™ for your own Google
Subjects:
Grades:
6th - 12th, Higher Education
Types:
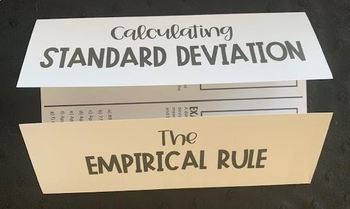
Standard Deviation and The Empirical Rule Foldable Notes - Fully Editable
This editable foldable provides students with an introduction to Standard Deviation and the Empirical Rule. There are two examples within the foldable along with steps and notes at the top of the page.Perfect for interactive math notebooks! I use this type of assignment during whole group guided instruction, but it would also work great for intervention, small group, centers, or during a tutoring session.This download includes a print + go PDF version, as well as the editable PowerPoint file.Th
Subjects:
Grades:
9th - 12th
CCSS:
Also included in: Data Analysis and Statistics Foldable Bundle
Counting Principle & Permutation Task Cards (Digital/PDF)
This download includes both a PDF and digital Google Forms version of this activity.Do you need more questions to use to provide practice with the counting principle and/or permutations? Here you go!These 36 task cards focus on using the counting principle and calculating permutations. Both color and black/white copies are included. Copy them onto cardstock and/or laminate them to create a long-lasting, reusable resource. Use a few at a time for focused practice or mix them together … your c
Subjects:
Grades:
7th - 12th
Types:

Statistics Normal Distribution Area Curve QR Code Activity
This is a QR code scavenger hunt activity that requires students to solve for the area under a normal standard distribution curve given the z-score. Directions: Print out the pages and hang around the classroom in a random order, creating 15 stations. (If you hang them in the order they are originally printed, the students will just be working around the room in a circle, versus "hunting" for the answers. Students start at one QR code. When they scan the code, it will give them a problem to solv
Subjects:
Grades:
9th - 12th
Types:
CCSS:
Showing 1-24 of 157 results


