25 results
Statistics rubric microsofts
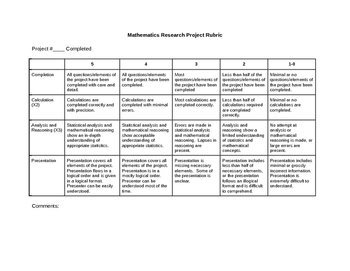
Math or Statistics Research Project Rubric
This editable rubric contains fields for project completion, calculation, analysis and reasoning, and presentation on a scale of five to one. It was originally designed for the Alberta Math 20-2 mathematics research project requirement, but is suitable for use across junior and senior high.
Subjects:
Grades:
9th - 11th
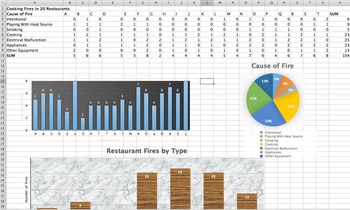
Statistics Project Unit 3 Spreadsheets Mean Median Mode Std. Deviation (2 day)
This is a 1-2 day project aimed at introducing a statistics class to Excel (or Numbers) who are familiar with Pie Charts, Bar Charts, Measures of Central Tendency, and Standard Deviation. The students will input data (included) into Excel (on fires in restaurants), form their own Bar Charts and Pie Charts, and be able to input formulas into the Excel to automatically calculate statistics. Students will be given the opportunity to explore different charts and design their charts to make them colo
Subjects:
Grades:
9th - 12th, Higher Education, Adult Education
Analyzing Misleading Graphs
Students are to find a graph online. They are given a url and other resources on how to find it. From there, they are to write a paragraph analyzing the validity of the graph. They are to include the title, resource, what the article is trying to convey, how it is/is not misleading, and at least two suggestions on how to make the graph more clear. Since this is a web-based assignment, it would be perfect for distance learning. Included:Student directions (in word doc so editable for your classro
Subjects:
Grades:
7th - 12th
Types:
CCSS:
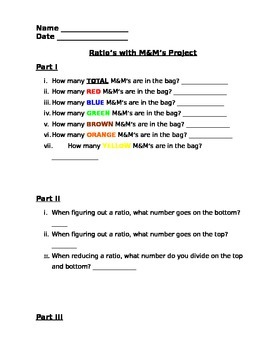
Ratios with M&M's Project
This is a quick assessment to help students figure out the ratios of M&M's in a bag. You provide the candy and I provide the worksheet. Students will be requested to open the bag, count all candies and than follow the directions marking ratios for each listed color.
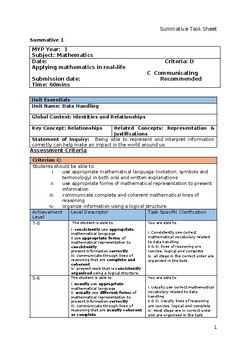
MYP-1_Data Handling_Criterion-C_D
This word document can be used as Summative/Formative assessment based on the topic Data Handling including topics- finding sector angle, constructing pie-charts, drawing dual bar-chart and writing conclusion on your infographics, what is the relationship between life expectancy and access to safe water? In your opinion, what can be done to improve access to safe water and increase life expectancy in countries with limited access to safe water? Explain your answer.It includes task specific des
Subjects:
Grades:
6th - 7th
Types:
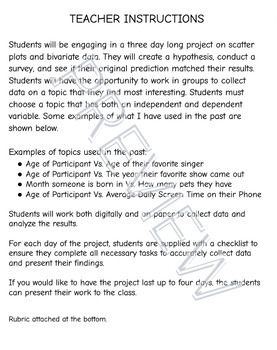
Scatter Plot and Bivariate Data Project
Students will be engaging in a three day long project on scatter plots and bivariate data. They will create a hypothesis, conduct a survey, and see if their original prediction matched their results. Students will have the opportunity to work in groups to collect data on a topic that they find most interesting. Rubric attached at the bottom.
Subjects:
Grades:
6th - 12th
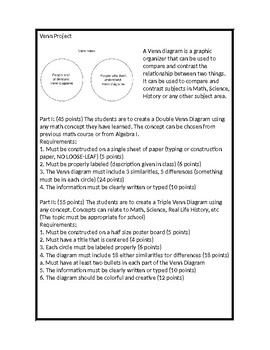
Venn Diagram Project
A Venn diagram is a graphic organizer that can be used to compare and contrast the relationship between two things. It can be used to compare and contrast subjects in Math, Science, History or any other subject area.
Subjects:
Grades:
3rd - 12th
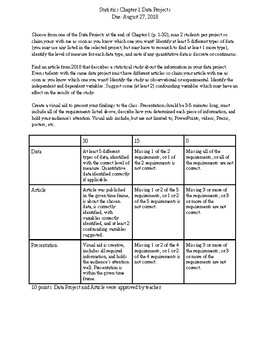
Bluman Statistics Chapter 1 Project
This is an end of Chapter 1 project aligned with the Bluman Statistics textbook, focussing on types of data, levels of measure, quantitative vs qualitative, continuous vs discrete, observational vs experimental, independent vs dependent variables, and confounding variables. It is a word document, so changes can be made for your individual class. Grading rubric is included.
Subjects:
Grades:
11th - 12th, Higher Education
Types:
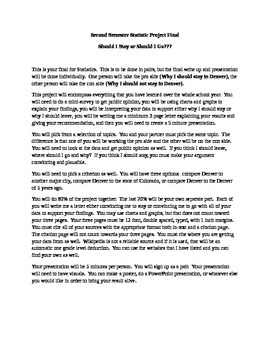
Should I Stay or Should I Go?
This is a statistics project that can be adapted to any grade level. This particular one is for already set up for a high school statistics class. This comes with websites for the students to use, three rubrics for grading, complete instructions, and sample topics. This project has been successful in my classroom. My students have been able to take everything that they have learned from the whole year and combine it into one project. It is a great project as a final!
Subjects:
Grades:
10th - 12th, Higher Education
Types:
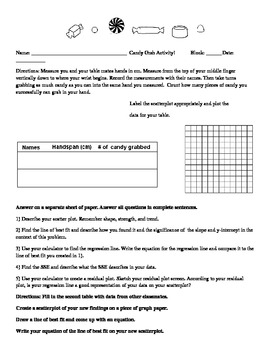
Candy Grab Activity
This activity investigates the relationship between hand size and the number of pieces of candy a student can grab. For this activity I offer students extra points on the activity if they bring a bag of wrapped candy. In this activity they work in groups and come up with the scatter plot, least squares regression line equation and correlation for the data they collect. There is a portion where they calculate the least squares regression line step-by-step. A graphing calculator is necessary for t
Subjects:
Grades:
10th - 12th
Types:
AP Statistics Final Project Rubric
This is a detailed rubric for help in grading the AP Statistics final cumulative project.
The document is in word format so that you can personalize it if desired.
Subjects:
Grades:
10th - 12th
Types:

Grade 6/7 Probability Game Design Project
This combines expectations from the Ontario 2020 Math curriculum for Grades 6 and 7. It asks students to work to collaborate and create an in-person, board game type game. There is a planning sheet and also a rubric included.
Subjects:
Grades:
5th - 7th
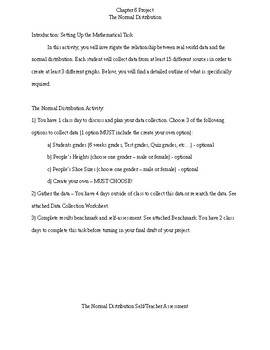
Bluman Statistics Chapter 6 Project
This project is aligned to chapter 6 of the Bluman Statistics textbook. It focusses on normal distributions, as well as collecting data, z-scores, mean and standard deviation, bell curves, and outliers. This is a word document so it can be edited if necessary.Grading rubric is included.
Subjects:
Grades:
11th - 12th
Types:
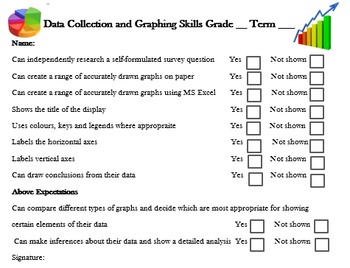
Graph and Data Assessment Checklist & Rubric
Short and quick-to-mark assessment rubric and checklist for graphing tasks suitable for students from grades 2 to 6.
You may also like:
-Comprehensive Multiplication Unit for free
- All Materials Maths units, just click on my store logo to view the full range.
Full set of Maths Assessments:
- Place Value Assessment
- Addition Assessment
- Subtraction Assessment
- Multiplication Assessment
- Division Assessment
- Fractions/Decimals Assessment
Subjects:
Grades:
2nd - 6th
Types:
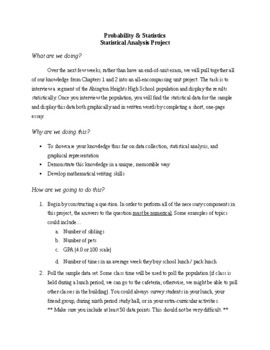
Statistical Analysis Project
Want your students to collect and summarize their own data in a project that is meaningful to them? This project covers the first two chapters of "Elementary Statistics: Picturing the World," primarily regarding valid sampling methods, measures of center/spread, and a variety of data displays. Rubric is attached for easy grading.
Subjects:
Grades:
9th - 12th
Types:
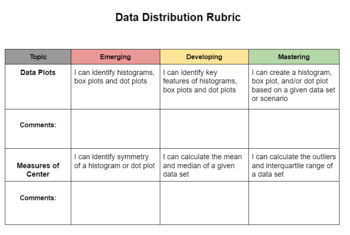
Data Distribution Rubric 9th Grade Math/Statistics
Breaks down data distribution into different plots used to visualize data and measures of center statistics. Beneficial for Mastery Learning and PCBL
Subjects:
Grades:
9th - 10th
Types:
CCSS:
Also included in: 9th Grade Rubrics for Mastery Learning or PCBL
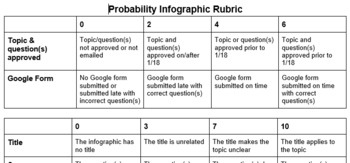
Probability & Statistics Project Rubric
This is the rubric for the Probability & Statistics Project:Students will use their knowledge of finding the probability of events, including multiplication and addition rules, as well as creating Venn diagrams or two-way frequency tables to create a project with real-world data.This rubric to makes grading quick and easy!
Subjects:
Grades:
6th - 12th
Types:
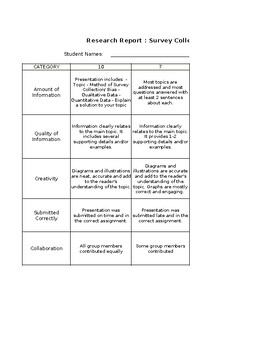
Survey Project - Rubric for Presentation - EXCEL
This is the Excel version of the rubric that I created for the presentation
Subjects:
Grades:
9th - 12th
Types:
Also included in: Survey Project
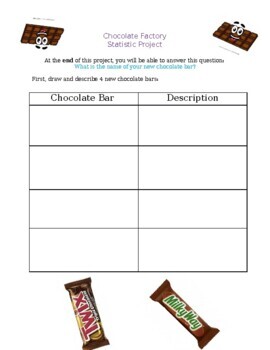
Chocolate Factory Statistics Project with Rubric
Chocolate Factory Statistics and Probability ProjectStudents are to come up with different chocolate bar designs and collect data on which is the most popular.At the end of the project, students can have a go at creating their chocolate bar packaging! Please see the store to see an additional, more comprehensive rubric.
Subjects:
Grades:
1st - 3rd
Types:
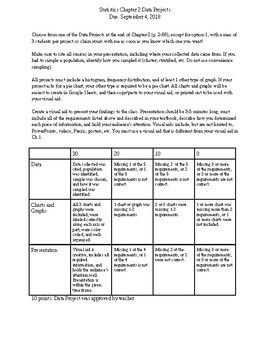
Bluman Statistics Chapter 2 Project
This project is aligned with chapter 2 of the Bluman Statistics textbook. It focusses primarily on sampling a population, creating a histogram and frequency distribution. This is a word document, so it can be adapted to fit the needs of you class. Grading rubric is included.
Subjects:
Grades:
11th - 12th
Types:
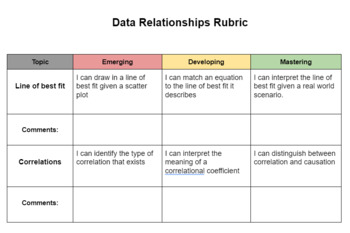
Data Relationship Rubric 9th Grade Math/Statistics
Describes data relationships in terms of correlations when provided bivariate data. Explores the relationship between correlations and causation. Beneficial for Mastery Learning and PCBL
Subjects:
Grades:
8th - 10th
Types:
CCSS:
Also included in: 9th Grade Rubrics for Mastery Learning or PCBL
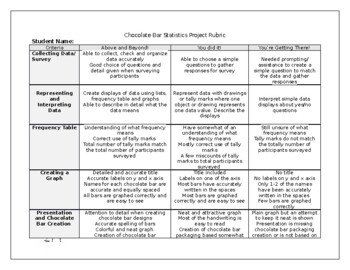
Chocolate Factory Statistics and Probability Project RUBRIC
An additional and more detailed rubric for the Chocolate Factory Statistics and Probability Project
Subjects:
Grades:
1st - 3rd
Types:
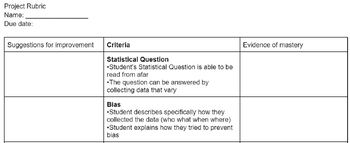
Statistics Project
Statistics project rubric. Throughout our statistics unit students completed small parts to the project, then I gave 50 minutes in class time for students to complete a poster summarizing their work. This is the 2 column rubric used.
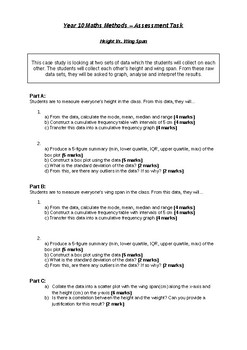
Year 10 Mathematics Statistics Assingment
A Statistics assignment which assesses the students on foundational content (mean, mode, median) through to 10A curriculum (standard deviation and outliers). Includes marking criteria and rubric.
Subjects:
Grades:
9th - 11th
Types:
Showing 1-24 of 25 results


