41 results
Statistics simulation microsofts
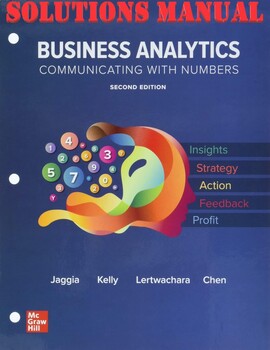
Business Analytics 2nd Edition Sanjiv Jaggia, Alison_SOLUTIONS MANUAL
SOLUTIONS MANUAL for Business Analytics, Communicating with Numbers 2nd Edition by Sanjiv Jaggia Professor, Alison Kelly Professor The download file inludes:Complete Chapters 1-18Compressed zip folder INSTRUCTOR MANUAL ALL CHAPTERSR Code GuidePython Guide and SolutionsExcel Spreadsheets and WorkBookSyllabus Undergrad Business AnalyticsSylabus Business Analytics and Data Mining for BusinessAppendix
Subjects:
Grades:
Higher Education, Adult Education, Staff
Types:
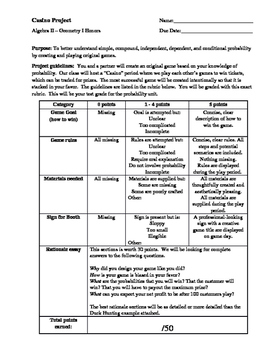
Carnival Probability Project
A project that feels like a game!
Students must create their own game, using probability to ensure THEY are favored to win....much like the house in a casino. Students can make games involving dice, spinners, cards, "fishing" ducks out of a pond, etc.
Assessed skills include: fundamental counting principal, theoretical probability, experimental probability, independent events, dependent events, creativity, writing, presentation. *Students must already know basic probability to complete this
Subjects:
Grades:
8th - 12th
Types:
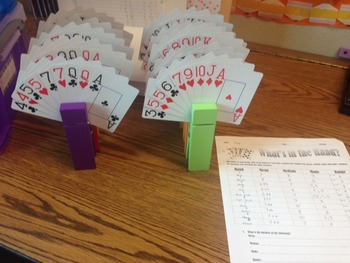
Statistics Mode, Median, Mean, Range Worksheet for Math or Psychology
What's in the Hand: Activity makes learning mode, median, mean, and range fun. You will need two packs of playing cards in order to use 10 different variations. I use giant clothes pins to hold a total of 9 cards for each station. Each student gets a worksheet and is assigned to a group of 4-5 students. Students will complete the first rotation by figuring the mean, median, mode, and range, and then rotate to each other station in about 5 min intervals. At the end they will answer the questions
Subjects:
Grades:
5th - 12th
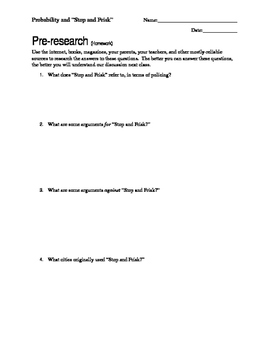
Using Probability to Teach Social Justice
This is an exploratory experiment/activity about basic probability. Students discover the differences between theoretical probability, experimental probability, and reality by taking a hard look at Stop and Frisk in urban areas. Students also deal with independent and dependent events.
By the end of the project, students will be able to:
Articulate the differences between theoretical and experimental probability through prediction and experimentation.
Articulate the differences between indep
Subjects:
Grades:
8th - 12th
Types:
CCSS:
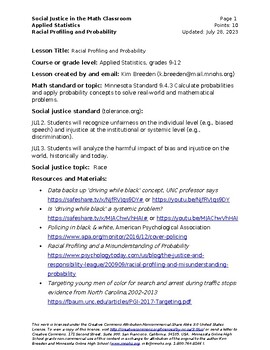
Racial Profiling and Probability (Social Justice Math)
In this assignment, you will investigate racial profiling, or Driving While Black (DWB). African Americans and Latinos/as have complained, filed suit, and organized against what they believe are racist police practices—being stopped, searched, harassed, and arrested because they “fit” a racial profile—they are African American (Black) or Latino/a (Brown). But is this true? How do we know? And can mathematics be a useful tool in helping us answer this question?These questions will be answered usi
Subjects:
Grades:
7th - 12th
Mean Absolute Deviation
This 25-slide PowerPoint presentation describes what Mean Absolute Deviation is and how to calculate it. The lesson uses two sets of sample data that turn out to have the same mean & median and a common range. Mean absolute deviation is introduced as another measurement that will show the difference in the two data sets. The presentation is designed to have students work with the sample data as well so they can learn as they go along. Content is based on common core standard CCSS.Math.Conten
Subjects:
Grades:
6th
CCSS:

Data Handling: Traffic Nightmare Tally and Bar Charts Project
A fantastic and very comprehensive resource including a Traffic Nightmare project book, lesson plan, student objective sheets, PowerPoint extended data collection exercise, PowerPoint Tally Chart Bingo, student bingo sheet and a PowerPoint introduction to using tally charts.
This project focuses on a scenario where the opening of a local supermarket has resulted in a great increase in heavy traffic through a residential area. The students tally the vehicles they see on screen to 'prove' the incr
Subjects:
Grades:
Not Grade Specific
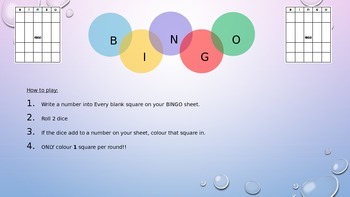
2 Dice Probability Bingo Game
Simple Bingo game where students can use a bingo game as an experiment to discover which values are the highest probability in either the sum of 2 dice or the difference of 2 dice.
Students fill in the sheets with values they think will come up. They get to fill in one square per round if the have a value that matches the sum/difference of the dice. After the first game is played, it should be played again to allow students to use their understanding to improve their chances. Eg. using more
Subjects:
Grades:
5th - 8th
Types:
Halloween Party - Math Problem Solving
In this activity, students will be planning a Halloween party for their class. They will need to "purchase" supplies for their party using a budget that you set. I set a budget that forces the students to make budget choices, i.e., I don't give them enough to buy everything they want. Students will work in partners to plan their party, making decisions based on their budget constraints. Students are also asked to perform some data analysis on the party choices. This is a good activity to do
Subjects:
Grades:
3rd - 7th
Samples/Populations/Predictions FUN Math Activity Project (7th grade) EDITABLE
This is a great project to use as an in class activity to review making predictions based on samples. You could use this as an individual or group assignment. It would also be very easy to assign online, if you have students learning in the virtual setting.
Subjects:
Grades:
7th
Types:
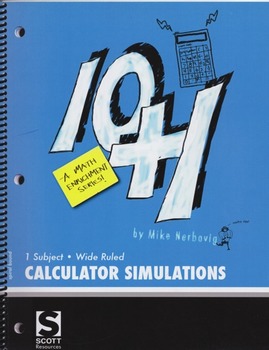
Calculator Simulations for Probability and Statistics
If you are obliged to follow a mandated math curriculum at your school, then I suggest you read no further because this site is probably not suitable for you. However, if you are looking for something that is different, yet might spark an interest in either you or your students, then it might be worthwhile for you to continue reading.In 1994 I wrote an alternative curriculum for our Probability and Statistics students that employed Monte Carlo simulations. The students’ reactions were so positi
Subjects:
Grades:
10th - 12th
Types:
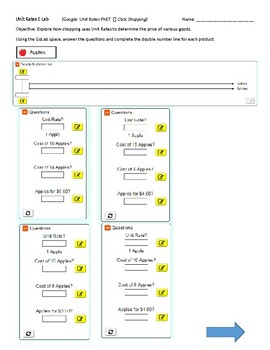
Interactive Online ELab Simulations Lab - Shopping Unit Rates Lab
In this FREE online interactive simulation provided by PhET, developed by the University of Colorado, students will explore unit rates through the process of buying goods. Students will explore how shopping uses unit rates to determine the price of various goods. Students will need a computer, tablet or IPad. These simulations were designed for IPad use. This handout goes directly with the Elab and contains directions on accessing the lab online as well as directions on how to complete the lab.
Subjects:
Grades:
5th - 8th
Types:
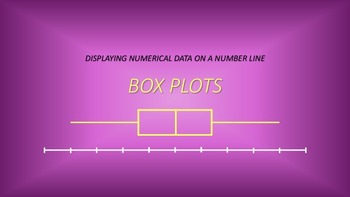
Numeric Data: Box Plots
This 29-slide PowerPoint presentation covers the basics of Box Plots in good detail. The lesson is based on math Common Core standard CCSS.Math.Content.6.SP.B.4 under the domain of Statistics and Probability. It begins with a review on number lines. The purpose & components of Box Plots are discussed next. Then, using sample data, it takes you step through step in determining the 5-number summary and constructing the Box Plot. This lesson could be used for a full class period. I recommend th
Subjects:
Grades:
6th
CCSS:
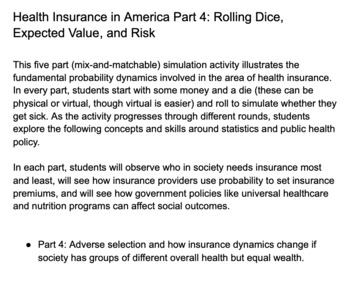
Health Insurance in America Part 4 (Activity and Teacher Guide)
Health Insurance in America Part 4: Rolling Dice, Expected Value, and RiskThis five part (mix-and-matchable) simulation activity illustrates the fundamental probability dynamics involved in the area of health insurance. In every part, students start with some money and a die (these can be physical or virtual, though virtual is easier) and roll to simulate whether they get sick. As the activity progresses through different rounds, students explore the following concepts and skills around statisti
Subjects:
Grades:
9th - 12th
Types:
CCSS:
Also included in: Simulating Health Insurance in America: Full Activity and Teacher Guide
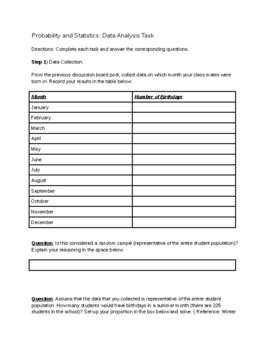
Birthday Probability: Data Analysis Task/Project
This great project is specifically designed for use during the Statistics and Probability unit for 7th grade. Purchase of this product will provide you with a fully editable document that you can edit to your liking.
Subjects:
Grades:
6th - 8th
Types:
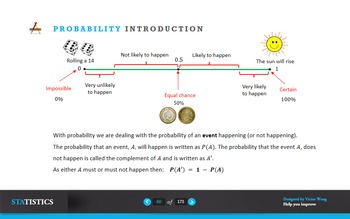
Probability
• evaluate probabilities in simple cases by means of enumeration
of equiprobable elementary events (e.g. for the total score when
two fair dice are thrown), or by calculation using permutations or
combinations;
• use addition and multiplication of probabilities, as appropriate, in
simple cases;
• understand the meaning of exclusive and independent events,
and calculate and use conditional probabilities in simple cases,
e.g. situations that can be represented by means of a tree diagram.
Subjects:
Grades:
Higher Education, Staff
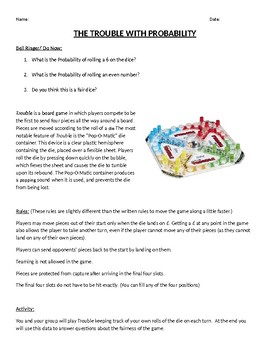
Trouble with Probability
Students will use the popper board game to study the probability of a fair dice.They will play a (speed-up) version of the classic board game to determine how many times each number of a die appears. They will calculate the percentage of occurrence of each number to determine if the die is fair. Follow up questions about how to change the probability of the die are also included as either homework or an extension of the activity.
Subjects:
Grades:
5th - 8th
Types:
CCSS:
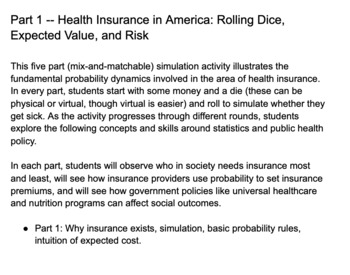
Health Insurance in America Part 1 (Activity and Teacher Guide)
Part 1 -- Health Insurance in America: Rolling Dice, Expected Value, and RiskThis five part (mix-and-matchable) simulation activity illustrates the fundamental probability dynamics involved in the area of health insurance. In every part, students start with some money and a die (these can be physical or virtual, though virtual is easier) and roll to simulate whether they get sick. As the activity progresses through different rounds, students explore the following concepts and skills around stati
Subjects:
Grades:
9th - 12th
Types:
CCSS:
Also included in: Simulating Health Insurance in America: Full Activity and Teacher Guide
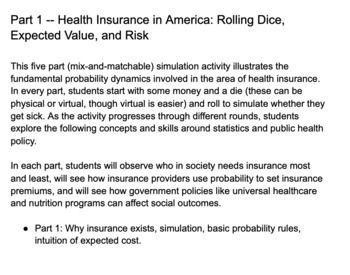
Health Insurance in America Part 1: Probability, Expected Value, and Risk
Health Insurance in America: Rolling Dice, Expected Value, and RiskThis five part (mix-and-matchable) simulation activity illustrates the fundamental probability dynamics involved in the area of health insurance. In every part, students start with some money and a die (these can be physical or virtual, though virtual is easier) and roll to simulate whether they get sick. In each part, students will observe who in society needs insurance most and least, will see how insurance providers use probab
Subjects:
Grades:
9th - 12th
Types:
CCSS:
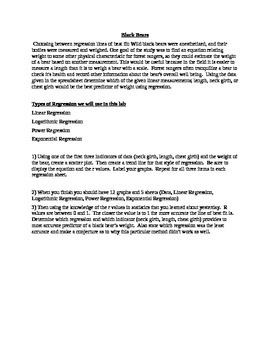
Comparing Linear, Quadratic, Exponential Regressions w/Spreadsheets
This project incorporates spreadsheets with scatter plots and lines of best fit. It asked students to perform various regressions, such as linear, power, exponential, and logarithmic, The students are asked to generate an model to help park rangers determine the weight of black bears by using only one of three measures, neck girth, length, and chest girth. Calculating the bears weights allow the rangers to anesthetize them in order for them to care for the bears. The r values in this project
Subjects:
Grades:
9th - 12th
Types:

A Fishy Situation
The multiple day activity is a simulation requiring students to collect, organize, categorize, and analyze data concerning a fish population in a lake. Students will discuss sampling, create various graphs, and create their own research plan. Career ties may be biologist, state wildlife and fisheries agents, and environmentalist.
Subjects:
Grades:
6th - 8th
Types:
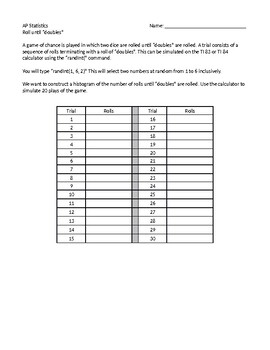
AP Statistics: Rolling Doubles Activity
Students use the random number generator on their calculators to simulate dice rolls. Students graph and describe the results. Students answer follow-up questions regarding mean versus median as well as the expected value.
Subjects:
Grades:
10th - 12th
Types:
CCSS:
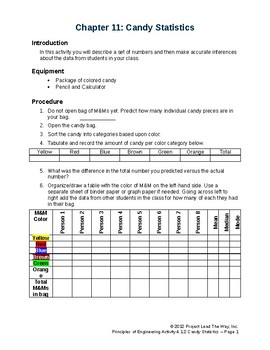
Candy Statistics
Kids have a chance to open individual bags of M&Ms and practice calculating probability of different colors and solving probability problems both independent and dependent.
Subjects:
Grades:
9th - 12th
Types:
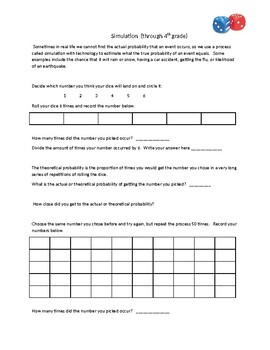
Probability Intro to simulation using dice
This is the perfect introductory activity to simulation and probability. It could be used in Algebra 2 and basic Statistics courses. It could also be used in 6th through 8th grade to introduce probability.
Subjects:
Grades:
6th - 12th
Showing 1-24 of 41 results


