100 results
Statistics interactive notebook microsofts
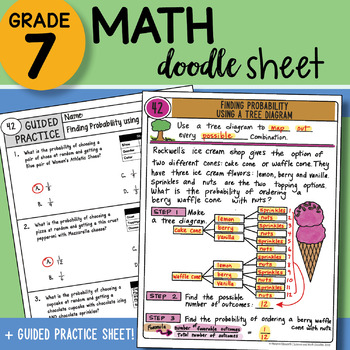
Math Doodle - Finding Probability using a Tree Diagram - Easy to Use Notes w PPT
7th Grade Math Doodle Sheet Product INCLUDES:Math Doodle Sheet - blank and keyGuided Practice Sheet - blank and keyPowerPoint – to show students the KEY– two versions of both sheets included: INB and large 8.5 x 11 size ALL TEKS Aligned– plan for the FULL year included with table of contents page for INB! SAVE BIG and buy the WHOLE YEAR SET found here:7th Grade Math Doodle Sheets ALL YEAR SET WHOLE YEAR SET List below:ALL TEKS Aligned– plan for the FULL year included! LIST of 88 Doodle Sheets p
Subjects:
Grades:
6th - 8th
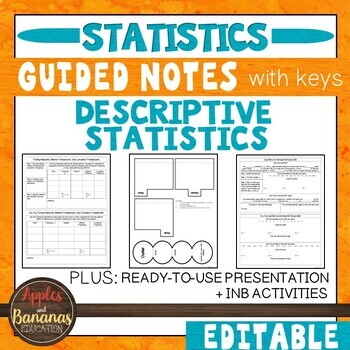
Descriptive Statistics- Guided Notes, Presentation, and INB Activities
This Introduction to Statistics product is flexible, editable, and can be used for in-person or distance learning. Take the time and stress out of creating your own guided notes and presentations. There are many ways to use this engaging bundle. It includes guided notes embedded with student practice problems (keys included), foldable activities, and a PowerPoint presentation for focused instruction. Choose what works best for your class/student and modify to make the content fit your needs. Not
Subjects:
Grades:
9th - 12th
CCSS:
Also included in: Custom Bundle for Viet
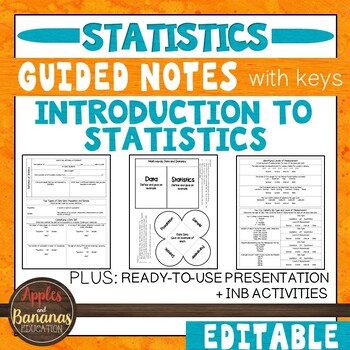
Introduction to Statistics - Guided Notes, Presentation, and INB Activities
This Introduction to Statistics product is flexible, editable, and can be used for in-person or distance learning. Take the time and stress out of creating your own guided notes and presentations. There are many ways to use this engaging bundle. It includes guided notes embedded with student practice problems (keys included), foldable activities, and a PowerPoint presentation for focused instruction. Choose what works best for your class/student and modify to make the content fit your needs. Not
Subjects:
Grades:
9th - 12th
CCSS:
Also included in: Custom Bundle for Viet
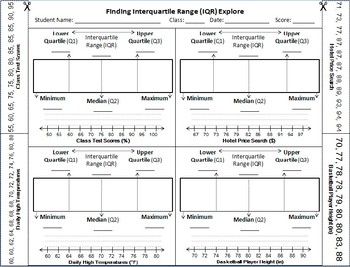
Finding and Comparing Interquartile Range (IQR)
This activity is designed for Texas TEKS listed below. Students use strips of data to fold into 'quartiles' and calculate the IQR.
represent numeric data graphically, including dot plots, stem-and-leaf plots, histograms, and box plots.[6.12A]
interpret numeric data summarized in dot plots, stem-and-leaf plots, histograms, and box plots.[6.13A]
compare two groups of numeric data using comparative dot plots or box plots by comparing their shapes, centers, and spreads.[7.12A]
Subjects:
Grades:
6th - 8th
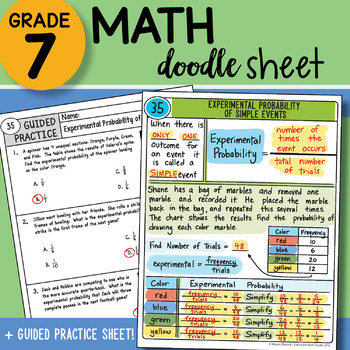
Math Doodle Sheet - Experimental Probability of Simple Events - Notes with PPT
7th Grade Math Doodle Sheet Product INCLUDES:Math Doodle Sheet - blank and keyGuided Practice Sheet - blank and keyPowerPoint – to show students the KEY– two versions of both sheets included: INB and large 8.5 x 11 size ALL TEKS Aligned– plan for the FULL year included with table of contents page for INB! SAVE BIG and buy the WHOLE YEAR SET found here:7th Grade Math Doodle Sheets ALL YEAR SET WHOLE YEAR SET List below:ALL TEKS Aligned– plan for the FULL year included! LIST of 88 Doodle Sheets p
Subjects:
Grades:
6th - 8th
Probability Interactive Notes
Includes fill in the blanks for students as well as an answer key.Topics covered:Simple ProbabilityExperimental ProbabilityPredicting OutcomesProbability ModelsCompound ProbabilityYou can also cut along the line in the middle to have composition notebook pages!
Subjects:
Grades:
5th - 8th
Types:
Also included in: 7th Grade Mathematics Interactive Notes
Statistics Interactive Notes
Includes fill in the blanks for students as well as an answer key.Topics covered:Populations and SamplesSampling (Simple, Stratified, Systematic)Mean, Median, Mode, and RangeQuartiles and Interquartile RangeBox PlotsBar ChartsPie ChartsYou can also cut along the line in the middle to have composition notebook pages!
Subjects:
Grades:
6th - 8th
Types:
Also included in: 7th Grade Mathematics Interactive Notes

Bundle: Mean, Median, Mode, & Range
This is the bundled set for mean, median, mode, and range. Besides the PowerPoint lesson, it also includes the set of 45 task cards. As a bonus, the bundle includes interactive notebook entries to further review and practice.(If you purchase this bundle, please don't purchase individual items.)
Subjects:
Grades:
6th - 7th
Probability Algebra 2
This bundle of resources for Algebra 2 Unit 10 Probability is available at a discount for a limited time. Included in this bundle (when it is finished):- Color-coded graphic organizers on probability topics listed below- Black-line master graphic organizers on probability topics listed below- Color coded notes with examples- Practice problems (good for homework)- Answer key for practice problems- 2 projects for assessment- Paper chain, card sort, task cards and more for additional practice- Sug
Subjects:
Grades:
10th - 12th
CCSS:
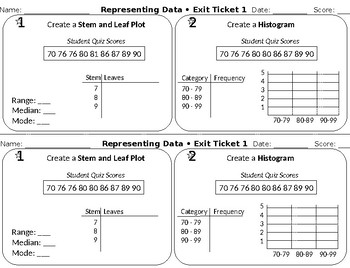
Representing Data - Dot Plot - Box Plot - Stem Leaf Plot - Histogram
Representing Data - Dot Plot - Box Plot - Stem Leaf Plot - Histogram
Texas TEKS
Subjects:
Grades:
6th - 7th
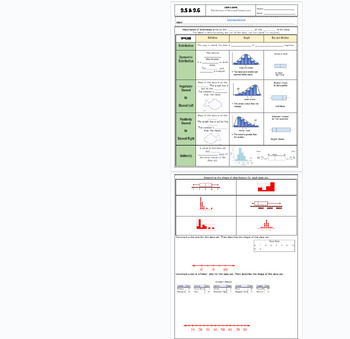
Data Distribution positive/negative skewed fillable notes UPDATED
Unit 9: Data and Stats: Updated(No 9.3/ Skip)9.5/9.6 Data Distribution (skewness)Students go over the vocabulary and complete the examples with the vocabulary scaffolded. Skewness is explained and how to identify it comparing data charts and box and whisker plots. Uses many visuals and examples to differentiate between that different graphs. Notes are scaffolded. Includes hook video hyperlinked on the "learning objective" title. Key is included and hyperlinked as a PDF in the heading highlighted
Subjects:
Grades:
6th - 12th, Higher Education, Adult Education
CCSS:
Also included in: Unit 9: Data and Statistics Fillable Notes
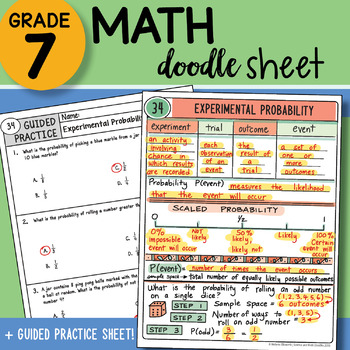
Math Doodle - Experimental Probability - Easy to Use Notes with PPT
7th Grade Math Doodle Sheet Product INCLUDES:Math Doodle Sheet - blank and keyGuided Practice Sheet - blank and keyPowerPoint – to show students the KEY– two versions of both sheets included: INB and large 8.5 x 11 size ALL TEKS Aligned– plan for the FULL year included with table of contents page for INB! SAVE BIG and buy the WHOLE YEAR SET found here:7th Grade Math Doodle Sheets ALL YEAR SET WHOLE YEAR SET List below:ALL TEKS Aligned– plan for the FULL year included! LIST of 88 Doodle Sheets p
Subjects:
Grades:
6th - 8th
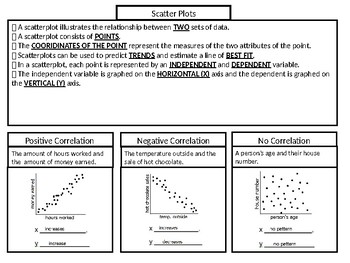
Scatter Plot Notes SOL 8.13
SOL 8.13 The student will a) represent data in scatterplots; b) make observations about data represented in scatterplots; and c) use a drawing to estimate the line of best fit for data represented in a scatterplot.
Subjects:
Grades:
6th - 8th
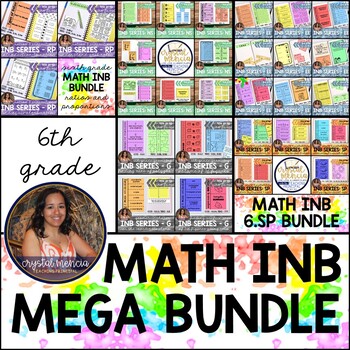
6th Grade Math INB MEGA BUNDLE (Interactive Notebook Series)
Looking for sixth grade math interactive notebook resources for the WHOLE YEAR? This mega bundle is for you! All activities included are LOW PREP and come with answer keys! Each blackline master included in this resource reduces paper use by providing materials for at least two (2) students and are perfectly sized for composition notebook use. Pricing will increase as the bundle is completed.WHAT'S INCLUDED:→ terms of use/how to use this product→ real-life photos of completed pages in a student
Subjects:
Grades:
5th - 7th
Standard Deviation Fillable Notes UPDATED
Unit 9: Data and Stats: Updated(No 9.3/ Skip)9.4 B Standard DeviationStudents go over the vocabulary and complete the examples with the vocabulary scaffolded. Standard deviation is long hand calculated by showing each step of the process (difference of squares). Real-world examples are explained in notes before calculating to show the importance of this stat and why it is used so often to verify valuable and effective data. Notes are scaffolded. Includes hook video hyperlinked on the "learning o
Subjects:
Grades:
7th - 12th, Higher Education, Adult Education
CCSS:
Also included in: Unit 9: Data and Statistics Fillable Notes
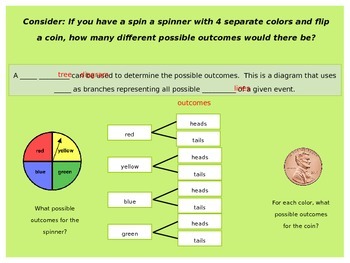
Statistics: Package of all PowerPoints and Interactive Math Notebook
This zip file includes all seven of my PowerPoint and math interactive notebook pages that correspond with each PowerPoint. The topics include fundamental counting principle, permutations, combinations, probability, odds, mutually exclusive and inclusive events, and independent and dependent events. Each can be purchased separately for $2 each, but there is a savings in buying the entire package together.
Subjects:
Grades:
6th - 9th
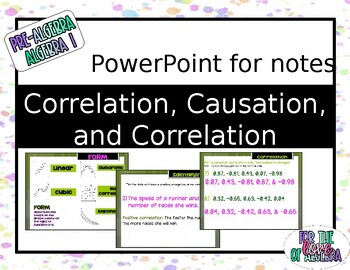
Correlation, Causation, and r PPT for notes (GSE Algebra 1)
This is the PowerPoint that goes along with Correlation, Causation, and r NOTES for interactive notebook. **It is editable for you to modify to your liking.
Subjects:
Grades:
7th - 10th
Also included in: Algebra 1 Interactive Notebook Notes - BUNDLE!!
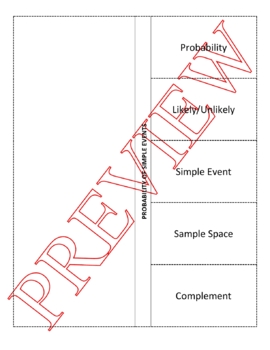
Probability Foldable and Powerpoint
Students will make a foldable that covers definition of probability, how to find probability of simple events, how likely something is to happen, sample space, and an event and it's complement.A power point presentation is also included which covers information in foldable.Answer key is included.docx and pdf files are both included in the zip file.The docx file can be edited if you have a Word program that uses these type files.Search Middle School Math Aplenty for other available products.
Subjects:
Grades:
7th - 8th

6th Grade *BUNDLE* Statistics and Probability Interactive Notebook Series
These sixth grade Statistics & Probability activities are LOW PREP and great for interactive notebooks! Each blackline master included in this resource reduces paper use by providing materials for at least two (2) students and are sized for composition notebook use.WHAT'S INCLUDED:→ terms of use/how to use this product→ real-life photos of completed pages in a student notebook→ learning standard with indicator of mastery for display→ answer key (for most activities)→ multiple activities for
Subjects:
Grades:
5th - 7th
Accuracy & Precision Presentation & Notes | Print | Digital | Distance Learning
Engage your students in more ways than before. With three differentiated notes options designed for a binder or an interactive notebook and a teacher-led or self-paced presentation, you have so many options to help your students master ACCURACY, PRECISION, PERCENT ERROR, and STANDARD DEVIATION. Also included are iPDF versions of the student notes that allow your students to complete their notes directly on the computer.Teacher-Led Presentation - Whether in a whole-group or small-group format, th
Subjects:
Grades:
8th - 11th
Also included in: Introduction to Science Presentations and Notes BUNDLE
Sixth Grade Common Core Statistics
This presentation covers all the standards for sixth grade Common Core statistics and probability. There is a PowerPoint/Google Slides version and a SmartBoard Notebook version. All the vocabulary terms are explained and examples given of all the types of data displays. The lessons can be used to introduce the concept, reinforce the concept, or review the concept. It would also be excellent when you are being observed to display the fact that you are working on implementing the Common Core mathe
Subjects:
Grades:
6th

Math Doodle - Finding Probability Using a Table - Easy to Use Notes with PPT
7th Grade Math Doodle Sheet Product INCLUDES:Math Doodle Sheet - blank and keyGuided Practice Sheet - blank and keyPowerPoint – to show students the KEY– two versions of both sheets included: INB and large 8.5 x 11 size ALL TEKS Aligned– plan for the FULL year included with table of contents page for INB! SAVE BIG and buy the WHOLE YEAR SET found here:7th Grade Math Doodle Sheets ALL YEAR SET WHOLE YEAR SET List below:ALL TEKS Aligned– plan for the FULL year included! LIST of 88 Doodle Sheets p
Subjects:
Grades:
6th - 8th
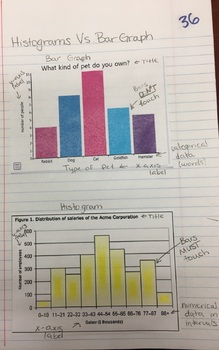
Introduction to Histogram Interactive Notebook
Your purchase comes with the document to create the Interactive Notebook pages featured above. Includes a bar graph and histogram so scholars can compare and contrast, and gives a data set, interval table, and graph space to create a histogram as a class.
Subjects:
Grades:
6th
CCSS:
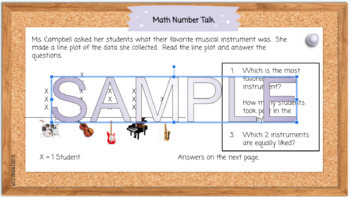
Line Plot Number Talks: Probability and Statistics
Number Talks are a great way to facilitate student interaction in all units of mathematics. Excellently crafted to review skills and review / practice questions. Includes slides for discussion of strategies and all answers provided! The following VA Standards of Learning are met in these slides: 5.15 The student will determine the probability of an outcome by constructing a sample space or using the Fundamental (Basic) Counting Principle. 5. 16 The student, given a practical problem, will a)
Subjects:
Grades:
4th - 6th
Showing 1-24 of 100 results


