30 results
Statistics homeschool curriculum microsofts
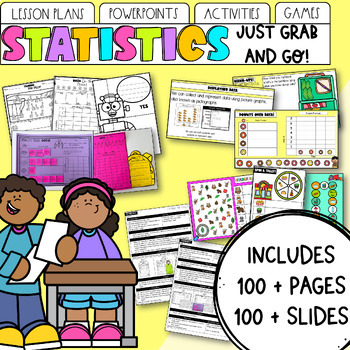
Statistics & Data | Maths Unit: Lessons, PowerPoint, Activities & Games
Looking for statistics and graphing planning that ticks all your boxes? Look no further! Teaching is hard enough, without spending hours creating differentiated lesson plans and activities. Not to mention the time spent planning what your early finishers can do, what assessment points to consider, or sourcing games that consolidate previous skills! With this Statistics and Data Unit, everything is done for you. Want to buy in early to the discounted bundle and get all updates for free? Find my G
Subjects:
Grades:
K - 2nd
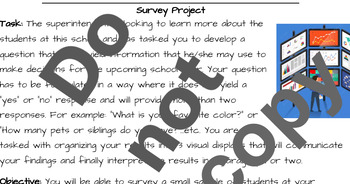
Samples & Population Survey Project
Students conduct a survey project to draw a generalized assumption based on the data collected about the whole population at their school. This project is fun and interactive, using real-world application of mathematical concepts covered in class.
Subjects:
Grades:
7th
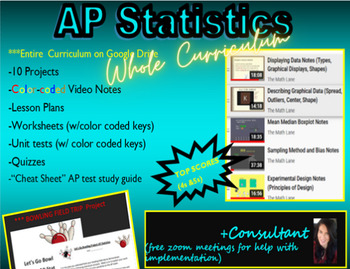
AP Statistics/Stats FULL Curriculum LINK (notes, wksts, PROJECTS) and Consultant
Get ready to supercharge your students' AP Statistics experience with this dynamic curriculum! With over 50% of students earning 4s or 5s on the AP exam, this program is proven to deliver top results. Featuring color-coded video notes, worksheets, activities, and 10 engaging projects, this curriculum is designed to keep students engaged and excited about statistics. Plus, with a Bowling Field Trip Project Opportunity included, students will have the chance to apply their knowledge in a real-worl
Subjects:
Grades:
10th - 12th
CCSS:
Describe the Distribution of a Data Set
This Common Core statistics and probability lesson teaches students how to describe the distribution of a data set. The lesson includes research-based strategies and strategic questions that prepare students for Common Core assessments. In this lesson, students will describe the distribution of data sets. This lesson focuses on describing a variety of statistical distributions in different situations. Students are asked to describe different related data sets and describe what that means. In
Subjects:
Grades:
5th - 7th
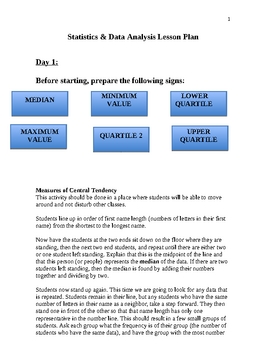
Up and Moving With Data Analysis and Statistics
Get your students up and moving as they create living graphs and actively find the median, mode, range, minimum and maximum values, upper and lower quartiles and never forget how they formed a box and whisker graph. Students will then collaborate on a survey project which will explore line plots, line graphs, bar graphs, histograms, circle graphs, scatter plots and stem and whisker plots. The unit will culminate with a discussion on biased questions and misleading graphs. A detailed rubric is at
Subjects:
Grades:
5th - 8th
Solve Percent Problems Using Proportions
This Common Core ratios and proportional relationships lesson covers how to solve multistep percent problems using proportions. The lesson includes research-based strategies and strategic questions that prepare students for Common Core assessments. In this lesson, students determine what the question is asking, and then the corresponding percent and quantity by drawing a diagram. Then, they set up a proportion for the percent and quantity, cross multiply, and solve for the unknown quantity. Fina
Subjects:
Grades:
6th - 8th
Types:
6th Grade Math Lesson Plans - Washington Common Core
Introducing "6th Grade Math Lesson Plans" - a comprehensive collection of engaging and standards-aligned lesson plans designed specifically for 6th-grade mathematics classrooms. With a focus on promoting conceptual understanding and real-world application, this resource is the ultimate tool for math teachers seeking to create meaningful learning experiences for their students.Key Features:Aligned with Standards: Each lesson plan is meticulously crafted to align with the 6th-grade Washington Comm
Subjects:
Grades:
6th

Ratios / Proportions / Percent for Sixth Graders
If your child is struggling with math, then this book is for you; the short book covers the topic and also contains 30 practice problems to work with.
This subject comes from the book “Sixth Grade Math (For Home School or Extra Practice)”; it more thoroughly covers more fifth grade topics to help your child get a better understanding of fourth grade math. If you purchased that book, or plan to purchase that book, do not purchase this, as the problems are the same.
Subjects:
Grades:
6th

Probability for Fifth Graders
If your child is struggling with math, then this book is for you; the short book covers the topic and also contains 30 practice problems to work with.
This subject comes from the book “Fifth Grade Math (For Homeschool or Extra Practice)”; it more thoroughly covers more fifth grade topics to help your child get a better understanding of fifth grade math. If you purchased that book, or plan to purchase that book, do not purchase this, as the problems are the same.
Subjects:
Grades:
5th
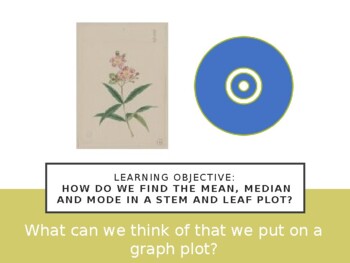
Mean, Median, and Mode, Stem & Leaf Plot
This visualized Power Point Presentation helps students to see how to find the mean, median, mode using graphics and charts. Step by step guided instructions.
Subjects:
Grades:
7th
Statistics Review
This review comes with three options for students to complete to Statistics. Each option allows for students to use various levels of taxonomy.Version A: Students will calculate the mean, median, mode, and range for the following set of data. Version B: Students will apply their knowledge of Statistics to solve various real-world problems.Version C: Students will collect data from friends/family and use it to create meaningful statistics.This assignment can be used to review statistics, reinforc
Subjects:
Grades:
5th - 7th
Also included in: 6th Grade Summer Review
Probability Review Marker Board Practice (Statistics/AP Statistics)
Get ready to supercharge your students' probability skills with this dynamic activity! Packed with 14 engaging review questions covering everything from 2 table probability to probability trees, independent events, dependent events, and mutually exclusive events, this activity is sure to keep your students on their toes. And with the answers conveniently provided on a PowerPoint presentation, you can easily post them on the board for quick and easy feedback. Perfect for Statistics and AP Statist
Subjects:
Grades:
9th - 12th
CCSS:
Introduction to Probability PowerPoint Presentation with practice
Learning Target:•I can determine the likelihood of an event happening.
Subjects:
Grades:
6th - 7th
Probability for Second Graders
If your child is struggling with math, then this book is for you; the short book covers the topic and also contains 30 practice problems to work with.
This subject comes from the book “Second Grade Math (For Home School or Extra Practice)”; it more thoroughly covers more fifth grade topics to help your child get a better understanding of fourth grade math. If you purchased that book, or plan to purchase that book, do not purchase this, as the problems are the same.
Subjects:
Grades:
2nd
Measures of Position – Quartiles and Percentiles (editable presentation)
Objectives of PPT (57 slides):To be able to find Quartiles, Percentiles, and Z-Scores.To be able to draw box plots.
Subjects:
Grades:
9th - 12th, Higher Education, Adult Education, Staff
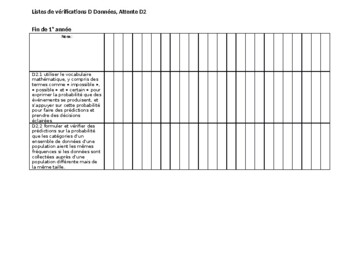
Tableau de curriculum de maths, Ontario 2020, Domaine D2
Voici le nouveau curriculum de maths, Domaine D2 (Données) sous forme de tableau Word, prêt à accepter les noms de vos élèves pour vous servir de liste de vérification ou évaluation. Vous pouvez également y mettre les mois de l'année afin de travailler votre planification à long terme! Toutes les attentes sont inclues, de la 1ère année à la 6ème, avec seulement de petits changements afin de faire rentrer toutes les attentes sur une seule page. Autres domaines disponibles!
Subjects:
Grades:
1st - 6th, Staff
Also included in: Tableaux de curriculum de maths, Ontario 2020
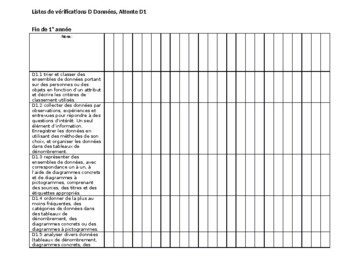
Tableau de curriculum de maths, Ontario 2020, Domaine D1
Voici le nouveau curriculum de maths, Domaine D1 (Données) sous forme de tableau Word, prêt à accepter les noms de vos élèves pour vous servir de liste de vérification ou évaluation. Vous pouvez également y mettre les mois de l'année afin de travailler votre planification à long terme! Toutes les attentes sont inclues, de la 1ère année à la 6ème, avec seulement de petits changements afin de faire rentrer toutes les attentes sur une seule page. Autres domaines disponibles!
Subjects:
Grades:
1st - 6th, Staff
Also included in: Tableaux de curriculum de maths, Ontario 2020

Comprehensive Statistics Worksheet Collection - 8 Units - 34 Worksheets
Enhance your statistics curriculum with this extensive collection of 34 worksheets spanning 8 units. Whether you're a math teacher looking for additional resources or a homeschooling parent seeking comprehensive materials, this worksheet collection provides a wealth of content to support students' understanding of statistics.Unit 1: Introduction to StatisticsWorksheets: 4Description: Introduce students to the fundamentals of statistics, including descriptive vs. inferential statistics, types of
Subjects:
Grades:
9th - 12th, Higher Education, Adult Education
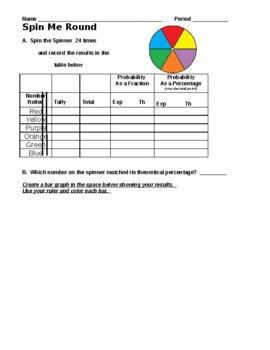
Spinner Exploration (Probability)
Let's student find theoretical and experimental probability
Subjects:
Grades:
5th - 11th
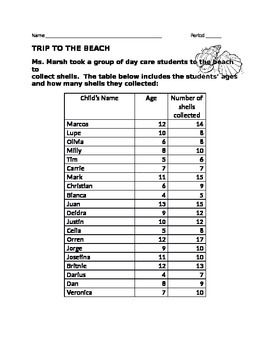
A Trip to the Beach
Assignment for calculating line of best fit and graphing a scatter plot
Subjects:
Grades:
9th - 12th
Types:
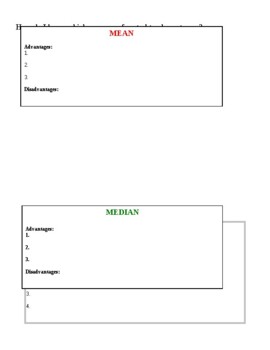
Differences and Uses of Mean, Median, and Mode Explained
One page of notes and the answers
Subjects:
Grades:
4th - 8th
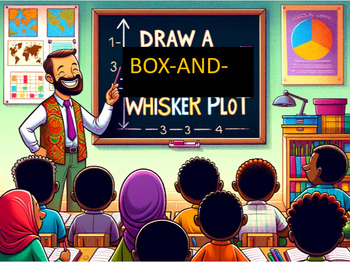
Lesson plan on DRAWING A BOX-AND-WHISKER PLOT (Super easy to follow)
Lesson plan on DRAWING A BOX-AND-WHISKER PLOT. Includes do now, lesson, practice problems, discussion questions, and answer key!
Subjects:
Grades:
6th - 8th
CCSS:
Lesson plan on SIMPLE PROBABILITY (Super easy to follow!)
Lesson plan on SIMPLE PROBABILITY. Includes Do Now, Lesson, Practice Problems, Discussion Questions, and Answer Key.
Subjects:
Grades:
6th - 8th
CCSS:
Lesson Plan on BOX-AND-WHISKER PLOTS / PERCENT OF DATA BETWEEN SUMMARY NUMBERS
Lesson plan on finding what percent of the data lies between any two summary numbers of a box-and-whisker plot. Includes do now, lesson, practice problems, discussion problems, and answer key!
Subjects:
Grades:
6th - 8th
CCSS:
Showing 1-24 of 30 results


