374 results
Statistics handout microsofts
Chi Squared
Chi SquaredTeaching Chi Squared to a Stats class or AP Bio and not sure where to start?! Well, you found it. I created this product for my husband, who teaching AP Biology. This pack includes a PPT introduction, complete with student fill-in-the-blank notes, that walk students through the steps of Chi Squared and gives them a general overview of how and why we use this test. Degrees of Freedom are explained, as well as p-value. Notes provide an additional practice problem to do as a class. This
Subjects:
Grades:
9th - 12th
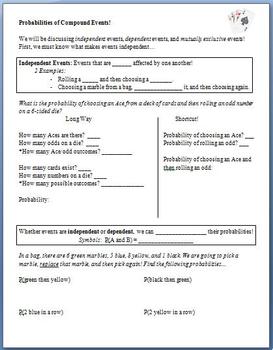
Probability of Compound Events (Guided Notes)
This lesson is meant to be used as guided notes for a whole class.
Students begin by learning what makes 2 events independent. After slowly working through a problem about rolling a die and choosing a card, they discover that they can multiply probabilities when working with these compound events. They then attempt problems involving picking marbles from a bag. Next, they learn about dependent events, and finally, mutually exclusive events.
The last 2 pages are a copy of the key.
Subjects:
Grades:
6th - 12th
Types:
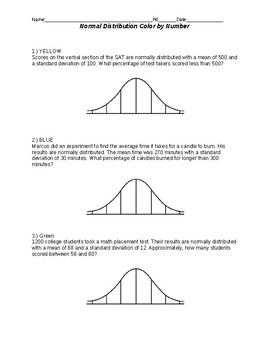
Color by Numbers Normal Distribution
These problems are very straight forward Normal Distribution problems using the Empirical Rule 68-95-99.7 My students enjoyed these. All pages are editable so make it your own, switch out colors and or scenarios.
Subjects:
Grades:
10th - 12th
Types:
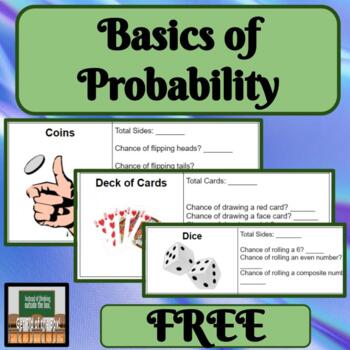
Basics of Probability Dice Cards Coins
About this Resource:Many students do not know all that is needed about dice, coins, and decks of cards. In order to be successful, it is important to cover all of this information first. Topic Covered:*Probability Ways to use this product in your classroom:-whole class-exploration-hands-on-small group-independent Other products with similar content.M&M's ProbabilityBox Plots with WeatherVisuals with Measures of Central TendencyCreating Line Plots
Subjects:
Grades:
6th - 9th
Types:
Also included in: Probability Bundle Hands On Dice Cards Coins Simple Probability
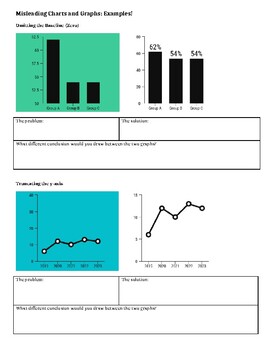
Misleading Charts and Graphs Analysis
This lesson outlines the four most common ways that writers and journalists display graphs that can cause people to draw incorrect conclusions. Students look at examples of bad graphs along with corrected versions and explain why one version is misleading and the other is correct. Independent practice is provided for the students to demonstrate understanding as well.
Subjects:
Grades:
Not Grade Specific
Types:
Psychology Random Sample Population Stats M&M Worksheet for Research Methods
Psychology or Statistics Random Sample & Population Statistics M&Ms Worksheet Activity for Research Methods includes a teacher direction sheet with materials that you need and how to complete the activity along with printable handout for students. *Student Favored activity*Please email me with any questions at ReadySetLearnSocialScience@yahoo.comIf you would like to get updates on NEW and CURRENT resources...►FOLLOW Me on Teachers Pay Teachers►FOLLOW Me on Pinterest►FOLLOW Me on Instagr
Subjects:
Grades:
4th - 12th, Adult Education
Types:

Adjustable Graph Templates
With Adjustable Graph Templates you'll receive a variety of graphs that are formatted to be easily adjustable, this is to help you create your own assignments. The full-page templates can be used as cut-outs, very useful for Foldables, and Interactive Notebooks. There are a variety of graph templates: coordinate axis (axes), 1st quadrant, number line, grid - and with a variety of units and sizes to suit your needs. To adjust a graph - click the desired graph and adjust the size by selecting-
Subjects:
Grades:
Not Grade Specific
Types:
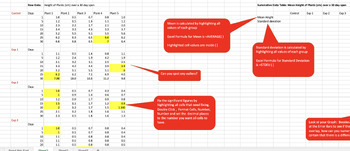
Bundle - Help with Science Fair Table, Graphs, Statistics using Excel.
This comprehensive 3-part bundle comprises a video tutorial, an informative handout, and an Excel file meticulously guiding students through a step-by-step process. The aim is to empower students with the skills to transform raw data into concise summative data tables and graphs, complete with standard deviation error bars. The tutorial covers the entire spectrum – from utilizing Excel for table and graph preparation to conducting statistical analyses using Anova tests, t-tests, or correlation m
Subjects:
Grades:
9th - 12th
Types:
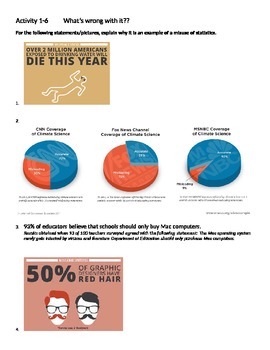
1-6 Misleading Statistics Worksheet
Students are asked to give a reason why each statistic is misleading. This accompanies Bluman's Elementary Statistic Book, section 1-6.
The worksheet has two pages, and answers are attached.
**There is a PowerPoint to accompany the worksheet for class discussion.
Subjects:
Grades:
9th - 12th
Types:
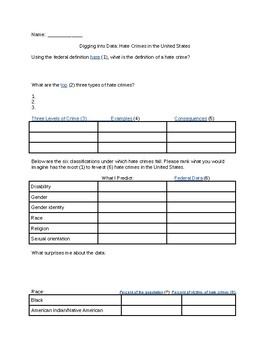
The 57 Bus- Looking at Hate Crime Data
A guided web search on hate crime data from the FBI, CDC, Pew Research Center, and U.S. Census Bureau. Uses reflection questions to make conclusions and predictions about the distribution of hate crimes. The kids are fascinated by the data!
Subjects:
Grades:
7th - 12th, Higher Education, Adult Education
Types:
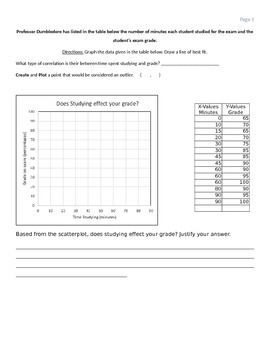
Scatter plot worksheet (Positive Correlation)
In this worksheet, the students are given a scenario and table of data points. The students must plot the points, draw a line of best fit, create & plot a possible outlier data point. Also, there is a short writing portion where students must reflect and write about the scatter plot scenario.
Subjects:
Grades:
6th - 9th
Types:
VM Numeracy Unit 2 - Civics - Data and Uncertainty
VCE VM Unit 2 Numeracy book, Civic - Data and Uncertainty. This unit looks at odds, reading and interpreting data, probability and statistics. Includes many hands-on activities.
Subjects:
Grades:
10th - 12th
Types:
Also included in: Bundle 1

Algebra 2 - Growing BUNDLE of Lessons
Here is our growing list of lessons for Algebra 2 Curriculum. Each lesson format includes the following:Warm Up ActivityStudent Self-Assessment of UnderstandingDirect Instruction – Power Point PresentationStudent Guided NotesCooperative Learning ActivityIndependent Practice ActivityExit SlipSequences and Series UnitLesson # 1 - Sequences and Partial SumsLesson # 2 - Arithmetic SequencesLesson # 3 - Geometric SequencesLesson # 4 - Geometric SeriesLesson # 5 - Counting PrinciplesLesson # 6 - Prob
Subjects:
Grades:
10th - 12th
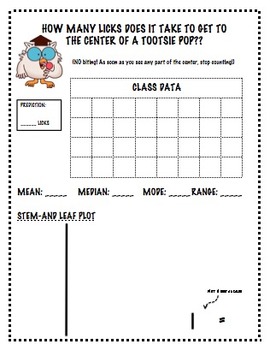
Tootsie Pop Activity w/ MMM, Stem and Leaf, Frequency Tables and Histograms
I would recommend using mini-Tootsie Pops so it doesn't take the kids forever to get to the center. I had them stop as soon as they saw any part of the center.
This activity gather data as a class and then students use the data to create a stem and leaf plot, frequency table and histogram. Student will also find mean, median, mode and range.
See my free download, "Tootsie Pop PowerPoint for a hook to get the kids started on this activity :-)
Subjects:
Grades:
6th - 8th
Types:
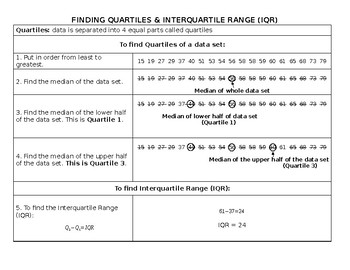
Finding Quartiles & Interquartile Range Notes
This easy-to-read, easy-to-follow handout helps kids remember how to find quartiles and Interquartile Range (IQR).
Subjects:
Grades:
5th - 8th
Types:
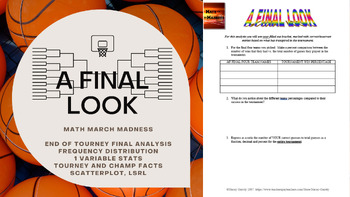
Math March Madness - A Final Look (Freq Distributions, Stats, Regression Lines)
Fill out a bracket, watch the tournament unfold and then mathematically analyze how you did! This activity is flexible enough to be used for a variety of levels. I have used all 6 pages for an AP Statistics class, and have used pages 1 through 5 for an Algebra or Algebra 2 class. You could even use it in lower levels as long as you are covering percents, and basic stats like mean, median, mode and graphing. The document is editable so you can adjust/delete to tailor to the level of statistic
Subjects:
Grades:
4th - 12th, Higher Education
Types:
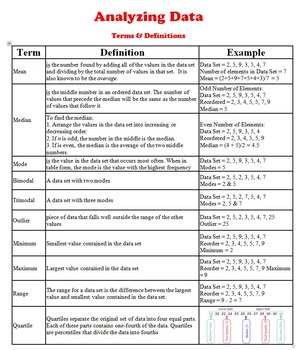
Data Analysis - Terms & Definitions (statistical measures definitions)
This Handout is part of : Maze - BUNDLE Statistical Measures (Mean, Median, Mode, & Range)
This handout is a quick reference sheet which includes the main definitions needed to introduce the data analysis terms in statistics. Terms such as: mean, median, mode, bimodal, outlier, minimum, range, quartile, box-and-whisker,.... etc. are some of the definitions shared on this handout.
Share it with your students, test them on it, and expect them to know it by heart. Those definitions are the
Subjects:
Grades:
6th - 12th, Higher Education, Adult Education
Types:

White Bear Experiment: Students Conduct a Consciousness Experiment
My students like this quick and easy experiment. They replicate the famous "White Bear Experiment" on classmates or with others who volunteer for the study. They then chart their results. There is then a reading discussing people controlling their consciousness with a spot for students to reflect on the information.I use this for my psychology course when we discuss consciousness. There is no key for this as answers will vary depending on the results of their experiment.This experiment can s
Grades:
7th - 12th
Types:
Also included in: Psychology Curriculum Custom Bundle
Mean, Median, Mode, Range and Standard Deviation Summary
I use this MS PowerPoint presentation file to kickoff our study of Statistics in my 9th grade Math I or Algebra I classes. It reviews the definitions and detailed methods required to calculate the mean, median, mode, range and standard deviation of a data set(s). It is a totally animated ppt file and very easy for students to understand. Any of the ppt animations can be modified as desired by the presenter (teacher). It also includes 2 example problems for the students to complete at the en
Subjects:
Grades:
8th - 9th
CCSS:
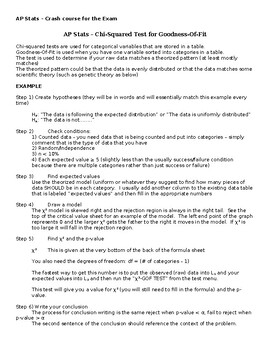
AP Statistics Crash Course - Chi-Squared Tests
The product is meant as a review and summary of chi-squared tests (GOF, homogeneity, and independence) to use prior to the AP Exam. This product contains a summary of the process, two worked-out examples, and two unsolved examples for students to practice.
Subjects:
Grades:
10th - 12th
Types:
CCSS:
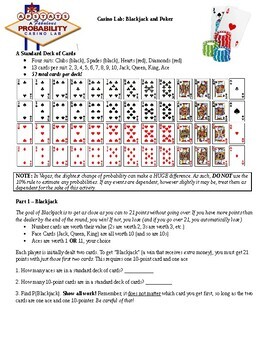
Probability Lab: Blackjack and Poker
Students apply their knowledge of the multiplication rule and combinations in order to analyze the probability of certain noteworthy outcomes in blackjack and poker.
Subjects:
Grades:
10th - 12th
Types:
CCSS:
Also included in: BUNDLE: Probability Labs
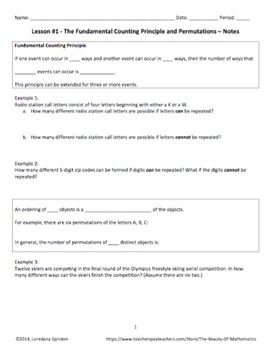
Probability and Statistics Units Bundle
This bundle includes both of my Probability Unit and my Statistics Unit (taught in Algebra 1, Algebra 2, or Statistics), also sold separately below:https://www.teacherspayteachers.com/Product/Statistics-Unit-2006021https://www.teacherspayteachers.com/Product/Probability-Unit-2006028Please check the links above for details about each unit. Buy the two units together and save!
Subjects:
Grades:
8th - 12th
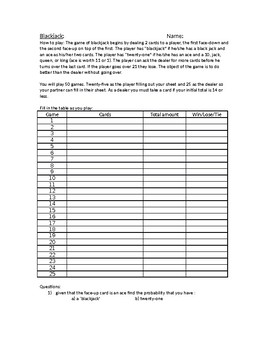
Finding 'and' probabilities using Blackjack
Students play Blackjack to understand 'and' probabilities. This handout includes the activity and notes.
Subjects:
Grades:
10th - 12th
Types:
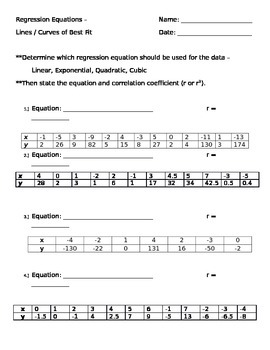
Exploring - Regression Equations Lines - Curves of Best Fit Handout
This assignment explores regression lines/curves (linear, quadratic, cubic, quartic) of best fit. It was created for Common Core Algebra I but could be used in stat class as well.
Subjects:
Grades:
9th - 12th
Types:
Showing 1-24 of 374 results


