135 results
Statistics rubric activboard activities
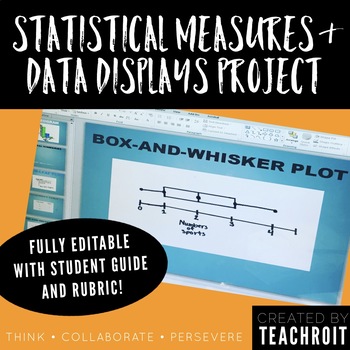
Statistics & Data Display Project for 6th Grade Math PBL (Fully Editable)
This product includes a student guide for a 6th grade middle school mathematics project that will require students to develop a statistical question, conduct a survey with their classmates, create numerical summaries, represent their findings using visual data displays, and finally present their findings! The thorough student guide provides step by step directions for each part of the project and could be used as either an in class project or to be assigned as homework. The student guide also in
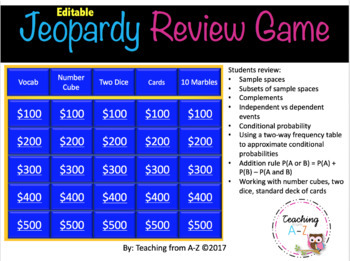
Probability Review Game
Use this Jeopardy-like review game to improve your students' understanding of key concepts in probability. This is a fun way to have students review:*Sample spaces*Subsets of sample spaces*Complements*Independent vs dependent events*Conditional probability*Using a two-way frequency table to approximate conditional probabilities*Addition rule P(A or B) = P(A) + P(B) – P(A and B)*Working with number cubes, two dice, standard deck of cardsThis is a PowerPoint Presentation. You can EDIT the problems
Subjects:
Grades:
9th - 12th
Also included in: Algebra Review Game Growing Bundle
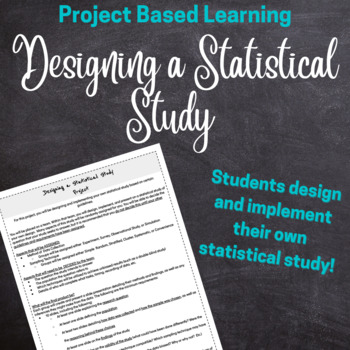
Statistics Project Design and Implement a Statistical Research Study Project
Prove that your students know how a good statistical or research study is designed! In this project, students will be assigned a method of data collection (either Observational Study, Experiment, Survey, or Simulation) and a sampling technique (either cluster, stratified, simple random, systemic, or convenience) and will design their own research question and study. The goal is for students to develop a research question that works well with the method of collection and sampling technique they w
Subjects:
Grades:
11th - 12th, Higher Education, Adult Education
Types:
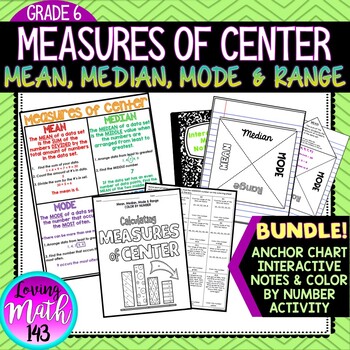
Mean Median Mode and Range Interactive Notes, Poster and Activity BUNDLE
Mean, Median, Mode & Range Color By Number ActivityThis color by number activity is a fun and engaging way for students to practice calculating the measures of center including mean, median, mode and range. Students will solve 16 questions involving mean, median mode, and range then find their answer on the color by number sheet. If their answer is not on the color by number then their answer is not correct. This activity is aligned with the sixth (6th) grade common core standards.WHATS INCL
Subjects:
Grades:
5th - 8th
MDM4U - Grade 12 Math - Mathematics of Data Management - FULL COURSE!
This is my complete course package for the Grade 12 Data Management (MDM4U) course following the Ontario Secondary Mathematics Curriculum. This package includes:Smart Notebook and PowerPoint lessons with Student PDF versions for every lesson of every unit in the course. (I have also included versions with my notes for your use)A complete student workbook that covers every lesson in the course. Each lesson concludes with appropriate workbook sections, so you can use whatever textbook you want!App
Subjects:
Grades:
12th
CCSS:
MDM4U - Probability Distributions Unit - Full Teacher Package
This is my complete Probability Distributions Unit package for the Grade 12 Data Management (MDM4U) course following the Ontario Secondary Mathematics Curriculum. This package includes:Smart Notebook and PowerPoint lessons with Student PDF versions for every lesson in the unit.A complete student workbook that covers every lesson in the unit. Each lesson concludes with appropriate workbook sections, so you can use whatever textbook you want!Appropriate unit tests/quizzes/assignments with answer k
Subjects:
Grades:
12th
MDM4U - Counting and Probability Unit - Full Teacher Package
This is my complete Counting and Probability Unit package for the Grade 12 Data Management (MDM4U) course following the Ontario Secondary Mathematics Curriculum. This package includes:Smart Notebook and PowerPoint lessons with Student PDF versions for every lesson in the unit.A complete student workbook that covers every lesson in the unit. Each lesson concludes with appropriate workbook sections, so you can use whatever textbook you want!Appropriate unit tests/quizzes/assignments with answer ke
Subjects:
Grades:
12th
MDM4U - Statistical Analysis Unit - Full Teacher Package
This is my complete Statistical Analysis Unit package for the Grade 12 Data Management (MDM4U) course following the Ontario Secondary Mathematics Curriculum. This package includes:Smart Notebook, PowerPoint lessons with Student PDF versions for every lesson in the unit.A complete student workbook that covers every lesson in the unit. Each lesson concludes with appropriate workbook sections, so you can use whatever textbook you want!Appropriate unit tests/quizzes/assignments with answer keys.A fu
Subjects:
Grades:
12th
MDM4U - Organization of Data for Analysis Unit - Full Teacher Package
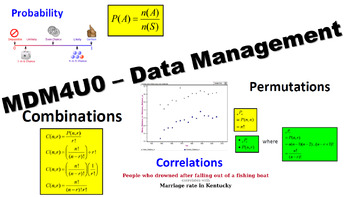
This is my complete Organization of Data for Analysis Unit package for the Grade 12 Data Management (MDM4U) course following the Ontario Secondary Mathematics Curriculum. This package includes:Smart Notebook and PowerPoint lessons with Student PDF versions for every lesson in the unit.A complete student workbook that covers every lesson in the unit. Each lesson concludes with appropriate workbook sections, so you can use whatever textbook you want!Appropriate unit tests/quizzes/assignments with
Subjects:
Grades:
12th
Categorical Data vs Numerical Data Flip Chart
In this flip chart, students will learn the difference between categorical data and numerical data, examples, and key vocabulary. The activinspire flip chart allows the teacher to reveal the information by removing the shapes over the correct information. At the end of the lesson are five questions which the students have to classify as categorical or numerical.
Grades:
5th - 8th
Types:
Math Jam Interactive Slides - 8th Gr Cate 4
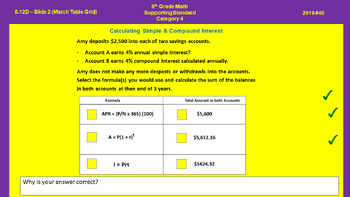
Jamboard slides aligned to Math STAAR Release problems and new items types that include Equation Editor, Text Entry, Graphing, Number Line, Hot Spot, Fraction Model, Drag n Drop, Match Table Grid and Multiselect. Resource can be used to expose students to the new item types on the STAAR Redesign math assessment.
Subjects:
Grades:
8th
Math Jam Interactive Slides - 7th Grade Cate 4
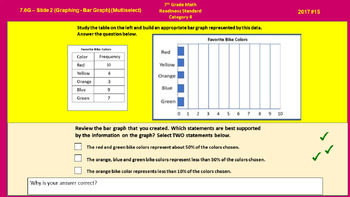
Jamboard slides aligned to Math STAAR Release problems and new items types that include Equation Editor, Text Entry, Graphing, Number Line, Hot Spot, Fraction Model, Drag n Drop, Match Table Grid and Multiselect. Resource can be used to expose students to the new item types on the STAAR Redesign math assessment.
Subjects:
Grades:
7th
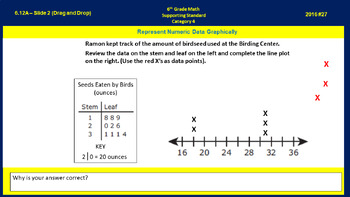
Math Jam Interactive Slides - 6th Gr Cate 4
Jamboard slides aligned to Math STAAR Release problems and new items types that include Equation Editor, Text Entry, Graphing, Number Line, Hot Spot, Fraction Model, Drag n Drop, Match Table Grid and Multiselect. Resource can be used to expose students to the new item types on the STAAR Redesign math assessment.
Subjects:
Grades:
6th
Types:
Statistics animated powerpoint lesson template
Content:1.Introduction2.Discrete Data3.Continuous Data4.Central Tendancy of a Data Set5.Range and Interquartile Range6.Box and Whisker Plot
Subjects:
Grades:
8th - 9th
Statistics animated powerpoint template lesson part 1
Statistics animated lesson:content:1.Introduction2.Discrete Data3.Continuous Data4.Central Tendancy of a Data Set
Subjects:
Grades:
8th - 9th
Also included in: Statistics animated powerpoint lesson template
Statistics animated powerpoint lesson template part 2
Statistics part 2:1.Range and Interquartile Range2.Box and Whisker Plot
Subjects:
Grades:
8th - 9th
Also included in: Statistics animated powerpoint lesson template
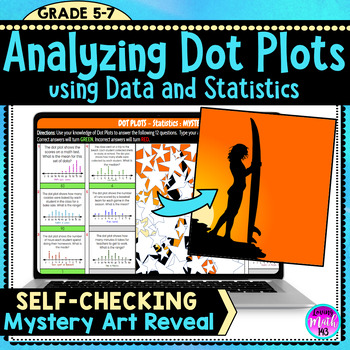
Analyzing Dot Plots using Data and Statistics Fun Digital Mystery Art Reveal
This Digital Self-Checking Math Activity allows middle school students to practice analyzing dot plots using data and statistics. Students will apply their understanding of line plots, mean, median, mode and range. Each correct will reveal part of a fun Mystery Picture! Great resource as independent practice or homework.This is a perfect activity to check for understanding of probability and statistics during distance learning and students using Google Classroom™. You can share this activity wit
Subjects:
Grades:
6th - 7th
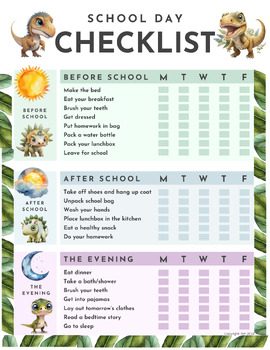
School Day Checklist
✏️ Get ready to ace every school day with our ultimate School Day Checklist – now on sale! Say goodbye to frantic mornings and hello to smooth sailing with our comprehensive checklist designed to streamline your child's routine. Whether you're a teacher, or parent, this checklist is your secret weapon for success! Grab yours now and make every school day a breeze!
Subjects:
Grades:
Not Grade Specific
Which Graph Do I Use to Display Data? Flip Chart
This review of various graphs indicates which graph is best to use for certain types of data. At the end, there is a 10 question multiple choice activote activity where the students are given a situation and have to choose the correct graph to display their data.
Subjects:
Grades:
4th - 8th
Types:

Fundamental Counting Principle and Probability Powerpoint
This 22 slide powerpoint is a great way to teach Tree Diagrams, The Fundamental Counting Principle, and Probability to your Middle Schools Students. It can be used with a smartboard to get your students active and involved or without a smartboard.
Subjects:
Grades:
6th - 8th, Adult Education
Project. Misleading Graphs Analysis Write Up with Rubric
Students will watch the TEDTalk How to spot a misleading graph - Lea Gaslowitz then do some research to find misleading graphs in the media!Objective. Students will research TWO misleading graphs, then create a google doc with those graphs and provide a written analysis. This is an individual assignment. Opportunity to explain...- Cherry Picking- Vertical axis manipulation- Horiztonal axis proportion- the author's motivation to graphically manipulate dataRubric is provided.
Subjects:
Grades:
8th - 12th
Middle School Survey Statistics Project Bundle
DescriptionA bundle of all materials needed for my Middle School Survey Project! Perfect for an end of year or statistics unit project.A fun, engaging, and active way for students to explore the foundations of statistical analysis and modeling.In this project students are tasked with creating a statistical question, surveying two relevant populations, calculating the measures of center and variability, making a dot plot, histogram, and box-and-whisker plot, and analyzing their data.Included in t
Subjects:
Grades:
6th - 9th
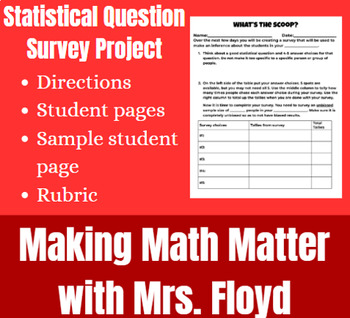
Statistical Question Survey Project
Students will be creating their own statistical questions to survey students in their grade (or school if you have a small school), the sample, and make an inference about all of the students in their grade(or school), the population. This would be great to either go along with the unit, right after, or at the end of the year for a review project. See the preview of what a project could look like for a student.Page with description, materials needed, and directionsStudent pagesSample student pag
Subjects:
Grades:
6th - 10th
Types:
Also included in: Statistics Activities Bundle
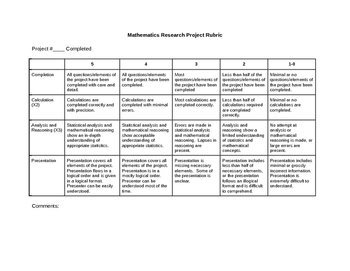
Math or Statistics Research Project Rubric
This editable rubric contains fields for project completion, calculation, analysis and reasoning, and presentation on a scale of five to one. It was originally designed for the Alberta Math 20-2 mathematics research project requirement, but is suitable for use across junior and senior high.
Subjects:
Grades:
9th - 11th
Showing 1-24 of 135 results


