1,220 results
Graphing projects under $5
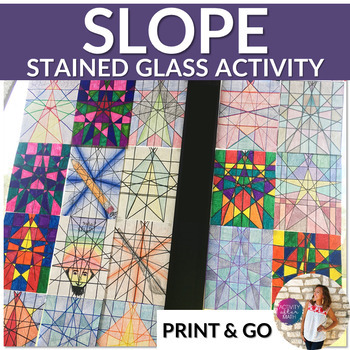
Stained Glass Slope Graphing Linear Equations Slope Intercept Form
Students will graph 18 equations written in slope-intercept form. All four types of slope are included(positive, negative, undefined, and zero). They will then darken the lines and color however they like creating a picture with a stained glass effect. This is a great activity that goes beyond the worksheet! You can save paper by printing the instructions on one side and the graph paper on the other!This resource includes:Student instructions pageGraph paper with the numbers and x- and y-axis la
Grades:
8th - 9th
Types:
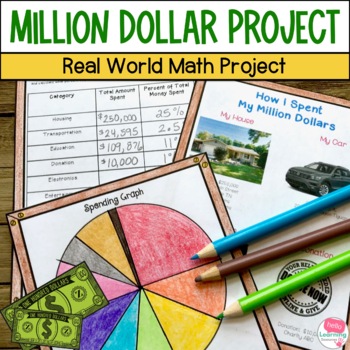
Million Dollar Project - Real World Math Project for Decimals and Money 4th 5th
This million dollar project gives your students a real world math project apply what they have learned about decimals, money, graphing, and percents. This makes a great financial literacy project to help kids understand costs, spending, and where money goes.Open the PREVIEW to see details of what is included.This resource includes:Teacher information and ideas for helpful websites for gathering informationStudent recording sheet for tracking spendingStudent sheet for calculating percentage of mo
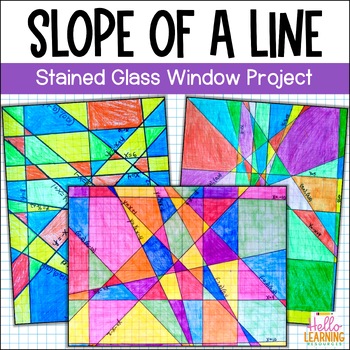
Slope Intercept Form Activity - Stained Glass Slope Project - Coloring Activity
Students will show what they know about slope intercept form, linear equations, and x and y intercepts in this fun and creative stained glass slope project! Perfect to use as an activity or assessment while teaching slope. Great integration of math and art!⭐ This resource includes:teacher activity directionsstudent directions3 linear equation worksheet pages for students to complete that determine the lines they will graphphotos of finished projectssample solution gradin
Subjects:
Grades:
6th - 7th
Types:
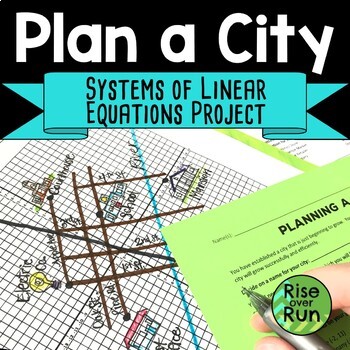
End of Year Math Project Graphing Systems of Linear Equations to Plan a City
Students plan their own city on a Cartesian plane, combining math skills and creativity. Students work in groups using graphing skills to create a city plan. Students will get practice with the following topics:• Graphing equations • Parallel and perpendicular lines • Systems of linear equations Some landmarks and roads are already established in the city. Students will graph these items, and then add their own. Each city will have some features in common, but each one will turn out unique t
Subjects:
Grades:
8th - 9th
Types:
CCSS:
Also included in: 8th Grade Math Activities & Lessons Bundle for the Whole Year
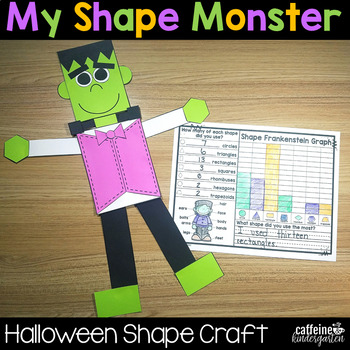
Halloween Math Shape Frankenstein Monster Craft Activity
This shape Frankenstein monster is an ADORABLE Halloween math craft activity that will provide a tactile experience with 2D shapes for your students. Included are multiple versions of data collection to promote further thinking about shapes for different levels and grade levels! Includes graphing and writing activities for cross-curricular learning. All blacklines for copies included. This is a perfect math activity for Kindergarten and First Grade!
Grades:
K - 2nd
Types:
Also included in: Shape Craft Math Bundle
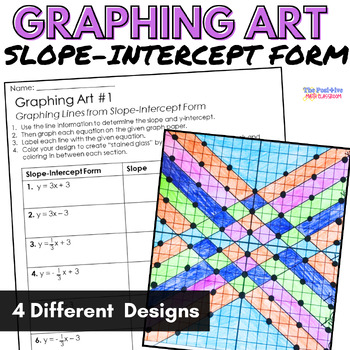
Slope Intercept Form Graphing Activity
Not only will this math art activity help your students practice writing and graphing equations in slope intercept form, but it will also add beautiful stained glass-styled art to your classroom! Best of all, this product includes 4 different options to help you differentiate within your math classroom and can be used for sub plans, extra credit, review, and more! Click here to save money when you purchase this product included in the Graphing Equations Art Bundle After graphing each set of lin
Grades:
7th - 9th
Types:
Also included in: Graphing Linear Equations Art Bundle
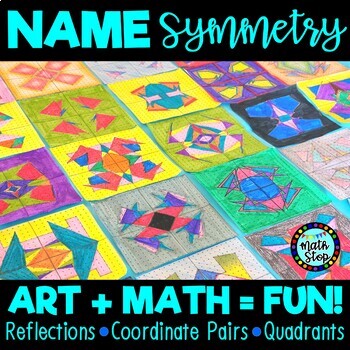
Math Art Activity Name Symmetry | Transformations Reflections Quadrants
A great personalized activity to incorporate art and math. Help your students develop their knowledge of graphing coordinate pairs, quadrants, and reflections about the x and y-axis with this fun and engaging art activity. Great for a geometry lesson plan that is looking to help solidify an understanding of quadrants, symmetry, transformations (reflections), with a cool symmetrical drawing as a finished product. Students personalize their experience by using the letters of their name to decode
Grades:
6th - 10th
Types:
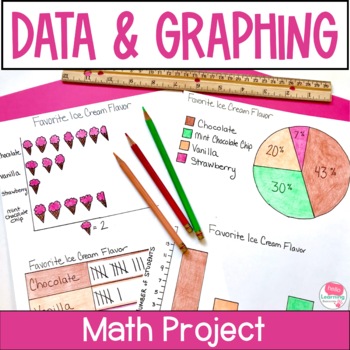
Data and Graphing Project - Real World Math Project Based Learning Activities
This data and graphing project gives your students a meaningful way to apply their data and graphing skills. Use this real world math project as an end of unit activity, enrichment activity or assessment. Easy to use and fun for students!Click the PREVIEW button above to see everything that is included in this fun math project!⭐ This resource includes:teacher information, directions and sample schedulesupply listgrading rubricstudent direction sheettwo data collection sheets (one for open ended
Subjects:
Grades:
4th - 6th
Types:
CCSS:
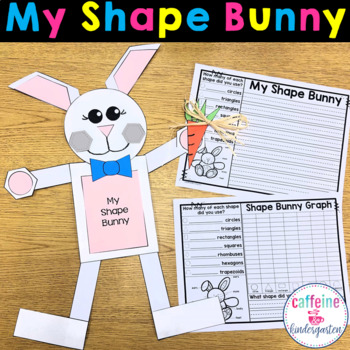
Shape Easter Bunny - Math Craft
This shape Easter Bunny math graphing craft is a super cute and fun way to provide a tactile experience with 2D shapes for your students. Included are multiple versions of data collection to promote further thinking about shapes for different levels and grade levels! Includes graphing and writing activities for cross-curricular learning. All blacklines for copies included.
•••••••••••••••••••••••••••••••••••••••••••••••••••••••••••••••••••••••••••••••••••••Check out these SPRING resources: Shape
Grades:
K - 2nd
Types:
Also included in: Shape Craft Math Bundle
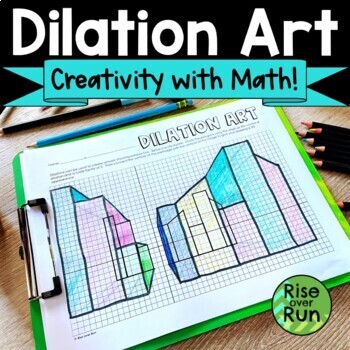
Dilation Activity Creating 3-D Perspective Art
Students explore how dilating images creates 3D perspective artwork in this fun math activity. The first page has a city skyline of buildings on a coordinate plane. Students dilate the figures by a scale factor of 2 to create a 3D drawing. The answer key is included for this page. Next students are given a blank coordinate grid to create their own preimage, which they then dilate by a scale factor of 0.5.This exercise shows students how math can be used to create artwork!This activity could be
Grades:
8th - 10th
Types:
Also included in: 8th Grade Geometry Unit Activities and Lessons
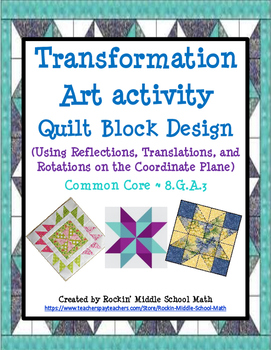
Transformation Art 1 - Quilt Activity/Class project (CCSS 8.G.A.2 and 8.G.A.3)
Translations, Reflections, and Rotations are used to create a beautiful 3-D quilt pattern that students can color using their creativity. No two students will color their design the same way. The purpose of this activity is for students to use the rules of how each transformation effects the coordinates of the pre image resulting in the post image. Reflections and Rotations are done about the Origin. I have included a Cheat sheet that you may give students to assist them and for studying the
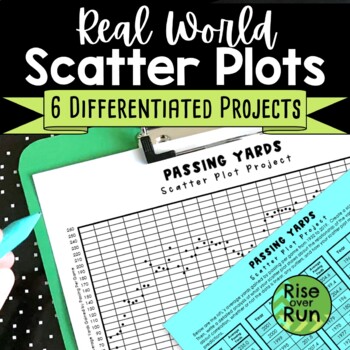
Scatter Plot Project with Real World Sports Data
Practice creating and analyzing scatter plots with these six differentiated real world projects. Students are provided statistics for a sport and must graph the data. Then, they write an analysis describing correlation, whether or not the data is linear, any outliers, and how the scatter plot might be used to make predictions. The scatterplots range from 38 points to 149 points, so they can be used to differentiate. The scatter plots will take a little time to plot, but they result in real
Subjects:
Grades:
8th - 9th
Types:
CCSS:
Also included in: 8th Grade Math Activities & Lessons Bundle for the Whole Year
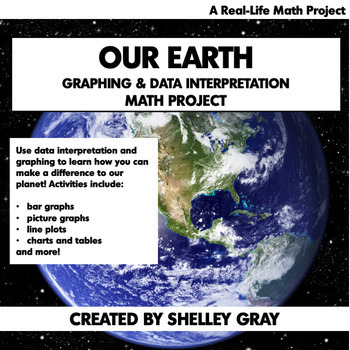
Earth Day Math Project for Graphing and Data Interpretation
This resource is included in PDF format for printing and in Google Slides™️ format for digital learning. This makes it useable with Google Classroom™️.Are you looking for a way to reinforce graphing and data interpretation concepts in an engaging way that helps your students make connections? “Our Earth” is a real-life math project where students will complete eleven different graphing and data-related tasks. These activities can be used as a package, or in isolation. They work great as a math c
Subjects:
Grades:
2nd - 3rd
Also included in: Math Projects & Escape Rooms for Grades 2-3 | Bundle of Ten
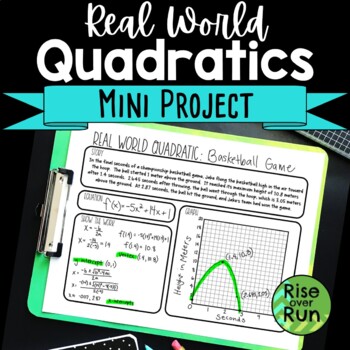
Quadratic Functions Mini Project or Extra Credit
This project for graphing quadratic equations is a great way to give students practice with real world problems. Included in this download are the following:Blank Project Sheet for StudentsProject Instruction Sheet30 Quadratic Equations with DescriptionsSample of Student Work30 different quadratic equations with descriptions are included, and each student will need one to create a project. Students will create the graph of their equation by finding the vertex and intercepts. Then, they will w
Grades:
9th - 11th
Types:
CCSS:
Also included in: Quadratic Functions Bundle for Algebra 1

Shape Chick - Easter Math Craft
This shape chick Easter math graphing craft is a super cute and fun way to provide a tactile experience with 2D shapes for your students. Included are multiple versions of data collection to promote further thinking about shapes for different levels and grade levels! Includes graphing and writing activities for cross-curricular learning. All blacklines for copies included.
•••••••••••••••••••••••••••••••••••••••••••••••••••••••••••••••••••••••••••••••••••••Check out these SPRING resources: Shape
Grades:
K - 2nd
Types:
Also included in: Shape Craft Math Bundle
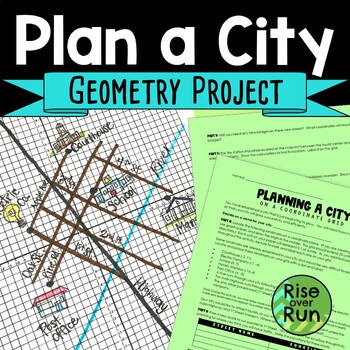
Graphing Parallel & Perpendicular Lines Project for Geometry
Students plan their own city, using the following math concepts: • Graphing equations • Parallel and perpendicular lines • Systems of linear equations • Midpoint • Partitioning a line segment in a given ratio Students follow the project instructions, locating landmarks and creating parallel and perpendicular streets. Each city will have some features in common, but each one will turn out unique to the student or group that created it! Provided is a PowerPoint to introduce students to city grids
Grades:
9th - 10th
Types:
CCSS:
Also included in: Parallel and Perpendicular Lines Bundle of Activities
Transformations ~ Stained Glass Project - 8.G.A.3
This challenging, high student interest activity quickly allows you to see if your students have mastered all 4 transformations (translations, rotations, reflections & dilations) on a coordinate plane. There are 20 problems consisting mostly of muti-step transformations. Students can either use a rule to find the image points, given the pre-image, or they can manually perform the transformations on a "scrap" sheet of graph paper.
Once all 20 transformations are plotted, students then colo
Grades:
7th - 9th
Types:
CCSS:
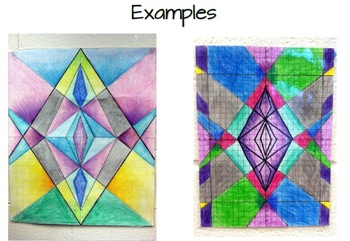
Stained Glass Graphing - Slope Intercept Form
Common Core Standards: 8.EE6, 8.F3, 8.F4
This activity is a fun art/math crossover project. Students will practice graphing lines in slope-intercept form. The equations include lines with positive, negative, zero, and undefined slope.The final product will resemble a stained-glass window that can be colored and displayed for a beautiful classroom decoration. Students really enjoy this project - it's a nice change of pace!
Differentiation:
The activity includes a set of equations and a set of o
Grades:
8th - 10th
Types:
Lucky Charms Cereal Data Analysis and Graphing Project St. Patrick's Day
Looking for a way to review data analysis and graphing skills without it being a bore? This Lucky Charms Cereal Data Analysis and Graphing Project is a fun activity to incorporate in March for St. Patrick's Day, but of course it works at any time of the year in a graphing unit or in a math-integrated unit. Your students will smile when you whip out the box of Lucky Charms and tell them that they are to pretend they are the Quality Control Department at the Cereal Company! This activity is fun an
Subjects:
Grades:
6th - 8th
Types:
NGSS:
MS-ETS1-4
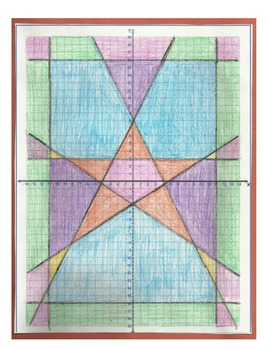
Graphing Linear Equations Quilt Project
Graphing Linear Equations Quilt ProjectI have created this project as a fun way to get my kids excited about graphing lines. I have always found that including art and coloring with math gets kids a bit more excited about learning and as an added bonus- they look great as classroom decorations when finished! These quilts focus on accuracy when graphing diagonal lines along with vertical and horizontal lines.This is a 100 point project that includes: directions for the students, a sheet for the s
Grades:
8th - 11th, Adult Education
Types:
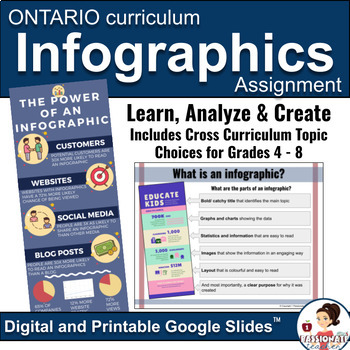
Infographics | New Ontario Math Curriculum 2020 | Digital Lesson and Assignment
Teach your students about the power of using infographics in data management to tell a story about any topic. This lesson, practice and creation activity is as flexible as you need it to be right now. Includes rubrics and multiple curriculum topic suggestions for grades 4, 5, 6, 7 and 8 from Ontario curriculum expectations, including the New Ontario Math Curriculum 2020 and can be used for virtual or in-person learning. And like with all of my products, this resource is completely editable! Perf
Subjects:
Grades:
4th - 8th
Types:

Stock Market Math Project | Build Personal Financial Literacy
This stock market project asks students to follow a stock of their choice for a week, calculate the daily and weekly percent change in price, estimate a line of fit for their scatter plot, find the slope and equation of their line of fit and write a final analysis of their data. The project is editable so you can customize as you need to for your students. Also now includes a link to a Google Sheet version for online learning.The final spreadsheet is formatted with formulas that automatically ca
Subjects:
Grades:
7th - 9th
Types:
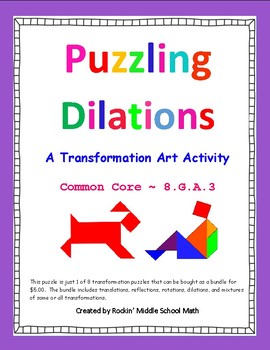
Dilations puzzle - Transformation Art activity - CCSS 8.G.A.3
This is a high interest, interactive activity that will allow you to easily see if your students have mastered dilations on a coordinate plane. Students must use the given pre-image points, perform the stated dilations, and then plot the new image points to create a figure which they can then color and decorate. This can be used as an in class or home project or an assessment. Common Core 8.G.A.3 - Describe the effect of dilations, translations, rotations, and reflections on two-dimensional figu
Grades:
7th - 10th
Types:
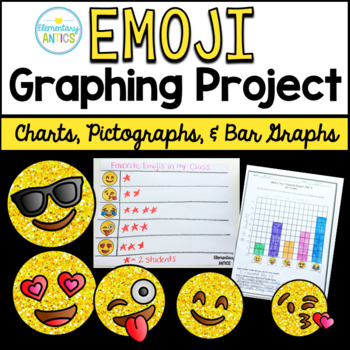
Emoji Graphs and Data Project {Charts, Pictographs, Bar Graphs}
This fun graphing project is a great way to introduce your students to collecting data and graphing- and the emojis keep them engaged and excited about learning!The Emoji Graphing Project includes 3 days of lesson plans!Part One: Conducting the SurveyPart Two: Making a Picture GraphPart Three: Create a Bar GraphAdditional Graphing Practice (3 more worksheets)Simple lesson plans are included for each part, but there is a ton of flexibility on how you can use this project in your classroom since y
Subjects:
Grades:
2nd - 3rd
Types:
Showing 1-24 of 1,220 results


