Grade 6 Graphing Project Rubric - Ontario
Ms Shannon Says
175 Followers
Description
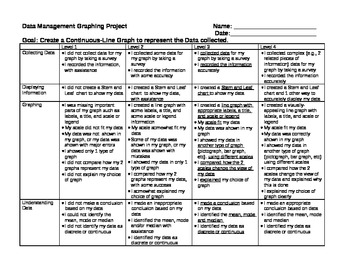
This is a rubric for a graphing project based on the Grade 6 Ontario Curriculum. It covers all points from the Grade 6 Data Management related to graphing (not probability), EXCEPT - determining how well the data represents a bigger population.
Download the preview to see a sample that one of my students made.
The project I did with my class was:
-collect data by doing a sample, research or experiment
-create a tally chart, stem and leaf plot, and t-chart showing the data
-create a continuous line graph, and another type of graph using a different scale to show the data
-make a summary of the data including mean, median, mode, etc.
-determine whether the data is continuous or discrete
-explain the choice of graph and why the different scales change the view of the data
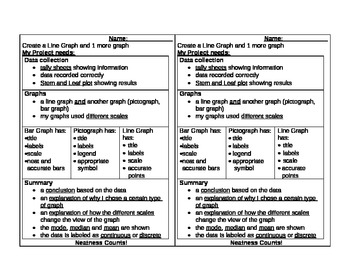
I've also included the student checklist that I gave to the kids so they could keep track of the expectations. They used it to make sure they were including everything necessary for success.... Success Criteria was a huge push for us last year, and I found this to be a really easy way to let the kids know what they had to do.
I hope you like this project! My class really loved it! I did too, because it brought all of their learning from the unit together, but they were excited to research things like Kobe Bryant's points per game or ticket prices to favourite attractions.
Total Pages
2 pages
Answer Key
N/A
Teaching Duration
N/A
Report this resource to TPT
Reported resources will be reviewed by our team. Report this resource to let us know if this resource violates TPT’s content guidelines.


