Collecting, Organizing and Interpreting Data Assignment -Data Management Digital

Description
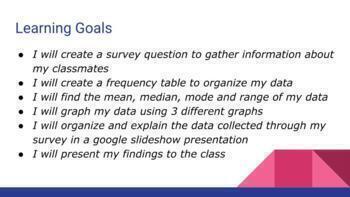
In this culminating task, students will create a survey question, organize their data using frequency tables, graph their data and interpret their results. They will also find the mean, median, mode and range of the data.
This is assignment asks students to create a presentation that will include the following:
- A survey question
- Mean, Median, Mode and Range of the data
- Frequency table for the data
- 3 different visual representations of their findings
- Interpretation of the results
This product includes:
- A slideshow with step by step instructions and examples
- Rubric
- Graph samples
This is a google slideshow, so it can be edited to suit your needs.
______________________________________________________________________
Want to save on TpT resources? Remember to leave a review! For every review you leave, you can earn credits towards future TpT purchases. Simply go to your “My Purchases” page and click the “Provide Feedback” button.
I truly value your feedback!
Follow me to receive updates on new products.
Thank you!


