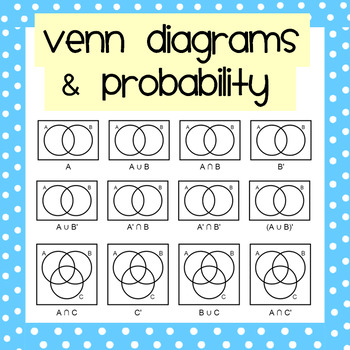
Venn Diagrams & Probability Mega Worksheet Pack
Nicola Waddilove
653 Followers
Grade Levels
9th - 12th
Subjects
Resource Type
Standards
CCSSHSS-CP.A.1
CCSSHSS-CP.A.2
CCSSHSS-CP.A.3
CCSSHSS-CP.A.4
Formats Included
- Zip
Pages
14 pages
Nicola Waddilove
653 Followers
What educators are saying
I have used this resource now for 2 semesters for intro to stats. My students really enjoyed solving these problems and each class of students really got involved and had many debates about how to go about figuring each diagram out.
Description
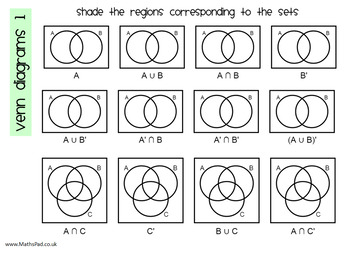
A thorough introduction to shading regions of venn diagrams and using them to calculate probabilities.
Includes 7 worksheets/activities:
1. Understanding intersections, unions and complements of sets.
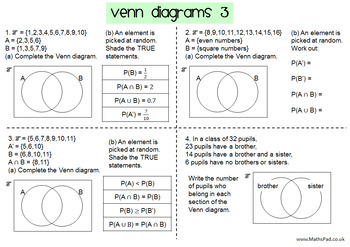
2 & 3. Probabilities from Venn diagrams: True or False & Matching Questions.
4. Comparing Venn Diagrams, Two-way Tables & Frequency Trees.
5. Completing Venn Diagrams from given information (more difficult).
6. Venn Diagrams & Conditional Probability
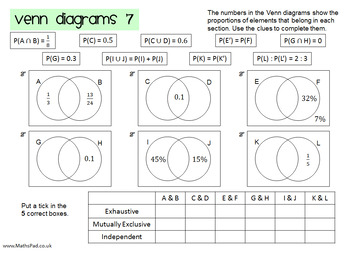
7. Recognising exhaustive, exclusive and independent events from venn diagrams.
Total Pages
14 pages
Answer Key
Included
Teaching Duration
3 hours
Report this resource to TPT
Reported resources will be reviewed by our team. Report this resource to let us know if this resource violates TPT’s content guidelines.
Standards
to see state-specific standards (only available in the US).
CCSSHSS-CP.A.1
Describe events as subsets of a sample space (the set of outcomes) using characteristics (or categories) of the outcomes, or as unions, intersections, or complements of other events (“or,” “and,” “not”).
CCSSHSS-CP.A.2
Understand that two events 𝘈 and 𝘉 are independent if the probability of 𝘈 and 𝘉 occurring together is the product of their probabilities, and use this characterization to determine if they are independent.
CCSSHSS-CP.A.3
Understand the conditional probability of 𝘈 given 𝘉 as 𝘗(𝘈 and 𝘉)/𝘗(𝘉), and interpret independence of 𝘈 and 𝘉 as saying that the conditional probability of 𝘈 given 𝘉 is the same as the probability of 𝘈, and the conditional probability of 𝘉 given 𝘈 is the same as the probability of 𝘉.
CCSSHSS-CP.A.4
Construct and interpret two-way frequency tables of data when two categories are associated with each object being classified. Use the two-way table as a sample space to decide if events are independent and to approximate conditional probabilities. For example, collect data from a random sample of students in your school on their favorite subject among math, science, and English. Estimate the probability that a randomly selected student from your school will favor science given that the student is in tenth grade. Do the same for other subjects and compare the results.


