8 results
High school statistics handouts for Microsoft Excel
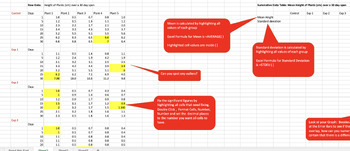
Bundle - Help with Science Fair Table, Graphs, Statistics using Excel.
This comprehensive 3-part bundle comprises a video tutorial, an informative handout, and an Excel file meticulously guiding students through a step-by-step process. The aim is to empower students with the skills to transform raw data into concise summative data tables and graphs, complete with standard deviation error bars. The tutorial covers the entire spectrum – from utilizing Excel for table and graph preparation to conducting statistical analyses using Anova tests, t-tests, or correlation m
Subjects:
Grades:
9th - 12th
Types:
VM Numeracy Unit 2 - Civics - Data and Uncertainty
VCE VM Unit 2 Numeracy book, Civic - Data and Uncertainty. This unit looks at odds, reading and interpreting data, probability and statistics. Includes many hands-on activities.
Subjects:
Grades:
10th - 12th
Types:
Also included in: Bundle 1
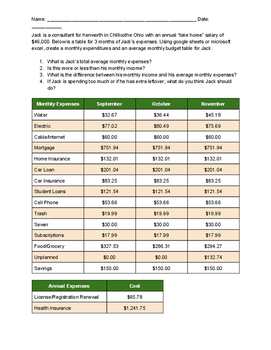
Budget Sheet Assignment
This sheet is a mock example of a person's expenses over the course of three months. It asks students to use technology like excel or google sheets to create tables of expenses. Then compare those tables with an average monthly spending budget sheet. This is mainly to be used to have students practice entering data into the spreadsheet and use the "sum" and "average" equations in the spreadsheet. Afterwards, the students can compare the expenses with the income to see if the budget is over or un
Subjects:
Grades:
9th - 12th
Types:
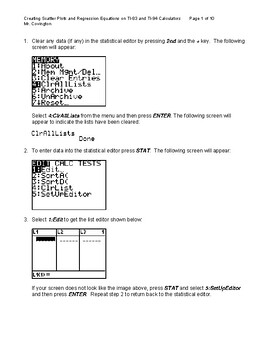
Creating Scatter Plots and Lines of best fit on TI-83/84 Graphing Calculator
A tutorial and reference guide for working with two-variable data to generate scatter plots and least squares method line of best fit on TI-83/84 graphing calculators and Microsoft Excel.
Subjects:
Grades:
8th - 12th, Higher Education, Adult Education
Types:
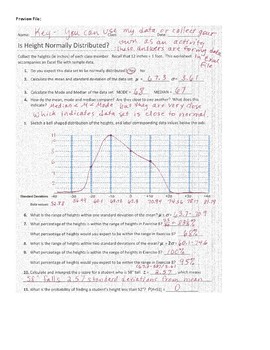
Is it normal? Height Data Activity
This activity was created to help introduce students to normal data distributions. This file contains an Excel workbook with instructions (for both 2010 and 2013 versions of Excel) for students to do the following:
Find the Mean, standard deviation, median, mode, and the distribution of data within a certain number of standard deviations from the mean.
Create bar graph and line chart of frequencies.
Answer questions regarding data on separate Worksheet.
This activity is totally editable, so you
Subjects:
Grades:
9th - 12th
Types:
Math - Data Management using Technology
This lesson is a detailed example of how Microsoft Excel can help not only statisticians, but the regular student complete tasks in a way that is functional, efficient and easy to read. It is a fantastic tool that helps the student build an appreciation and awareness of how to communicate properly in math. This lesson will allow students to reflect on the topic of “mean” within Data Management and encourage them to clarify and build on their mathematical arguments.
Lastly, this is a perfect w
Grades:
5th - 9th
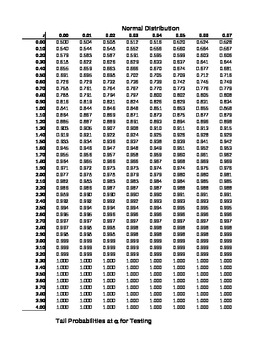
Z and t Distribution tables
Statistics t and Z distribution tables. The Z table is for the positive half of the standard normal curve. The tables were created for use with college statistics courses, but can be used with high school courses as well.
Subjects:
Grades:
11th - 12th, Higher Education
Types:
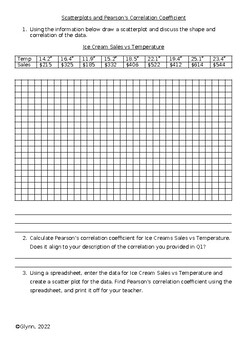
Scatterplots and Pearson's Correlation Activity
A quick activity to get students familiar with plotting scatterplots and using Pearson's correlation coefficient.
Subjects:
Grades:
10th - 11th
Types:
CCSS:
Showing 1-8 of 8 results


