28 results
High school statistics handouts for Easel Activities
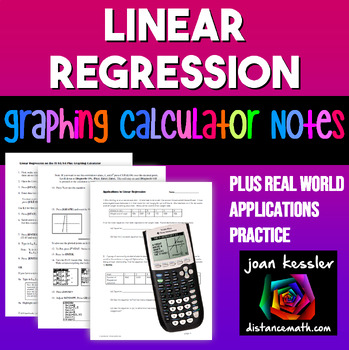
Linear Regression | TI-84 Graphing Calculator plus Applications
This clear, concise, step by step notes help your students use the TI 83 and TI 84 Graphing Calculator to enter data into lists, create a linear regression equation and to plot the equation along with the data simultaneously. Also included is a 3 page worksheet with five real world examples for students to practice. Solutions included. These can be used as Binder Notes or printed smaller for Interactive Notebooks._________________________________________________Related Products★ Quadratic Re
Subjects:
Grades:
9th - 11th, Higher Education
Types:
CCSS:
Also included in: Linear Functions and Systems Algebra 2 Unit 2 Activity Bundle
Finding Mean, Median, Mode, and Range
Simple worksheets (5 problems each) to introduce and practice finding the mean, median, mode, and range of a data set. Have students complete with or without calculator, depending on their instructional level. Product includes:-Reference posters for mean, median, mode, and range. Each poster includes the measures' definitions and directions for how to find them with an example.-5 worksheets about finding the mean.-5 worksheets about finding the median.-5 worksheets about finding the mode.-5 work
Subjects:
Grades:
1st - 12th
Types:
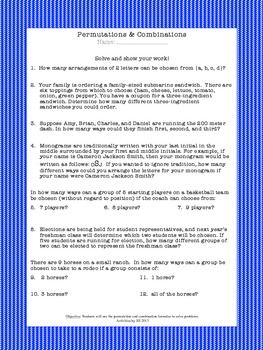
Permutations & Combinations Worksheet (Distance Learning)
Students will decide whether problems represent permutations or combinations, then use the permutation or combination formula to solve each problem. This worksheet provides routine practice.CCSS S-CPPermutations & Combinations Worksheet by Activities by Jill is licensed under a Creative Commons Attribution-NonCommercial-NoDerivatives 4.0 International License.
Subjects:
Grades:
8th - 11th
Types:
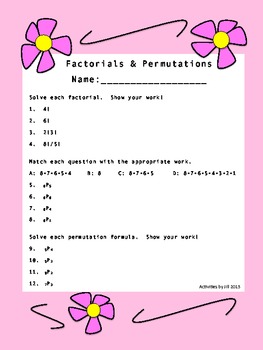
Factorials and Permutations Worksheet (Distance Learning)
Focus of Lesson: Calculate factorials and use the permutation formula. Teachers always need some routine practice for students. This twelve question worksheet will provide that or it can be used as a math center.CCSS S-CPFactorials and Permutations Worksheet by Activities by Jill is licensed under a Creative Commons Attribution-NonCommercial-NoDerivatives 4.0 International License.
Subjects:
Grades:
7th - 10th
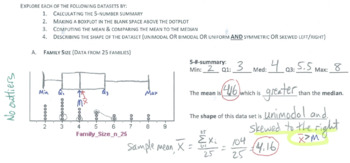
Statistics and Data Analysis: 5-number summary, box plots, and outliers
An introduction to data analysis, this 2-page handout (with answer KEY!) provides 6 datasets to analyze. Students compute the 5-number summary, make a box plot, describe the shape of a data set and relate the shape to the mean/median relationship, then finally go back through and check for outliers.
Subjects:
Grades:
9th - 12th
Types:
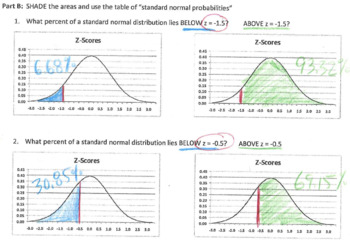
Statistics sketches: Z-scores and percentiles
Students will make a connection between z-scores and percentiles by shading the area under a bell curve (actually, 10 areas under 10 bell curves!). Finally, students will create a box plot under a standard normal distribution in order to make a strong connection between the unimodal symmetric normal distribution and its box plot.
Subjects:
Grades:
9th - 12th
Types:
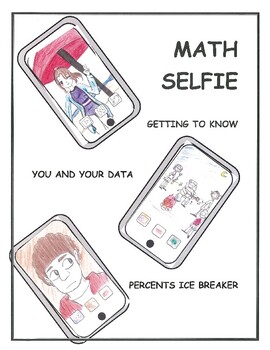
Distance Learning Math Activity You and Your Smart Phone Data
Create a Math Selfie and Use Percentages to uncover your data usage on our Smart Phone!Have the students create their picture and send it to you via email. Create a collage on your computer and send it back to them to create a sense of togetherness during social distancing.
Subjects:
Grades:
6th - 12th, Higher Education, Adult Education
Types:
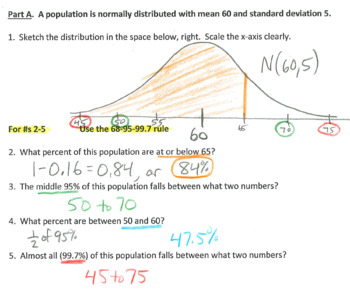
Statistics Quiz: the normal distribution
One practice quiz (with answer KEY!) and two forms of a "real quiz" (answer KEYs provided!) on the normal distribution. Students must sketch and label a bell curve, use the 68-95-99.7 rule, compute z-scores and use a z-table (commonly referred to as "Table A").
Subjects:
Grades:
9th - 12th
Types:
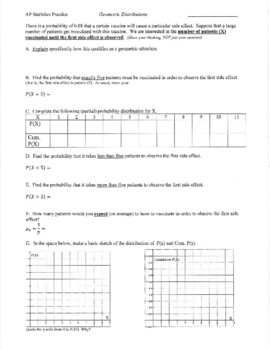
Statistics practice: Geometric and Binomial Probability distributions
In the context of a side effect from a vaccine, students practice the concepts and computations of the geometric and binomial probability distribution in this two-page handout with answer KEY provided!
Subjects:
Grades:
9th - 12th
Types:
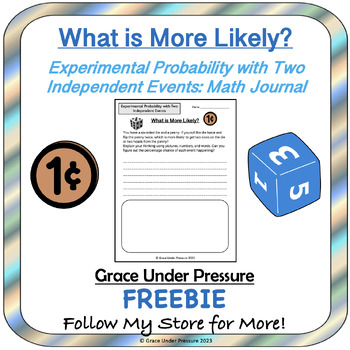
Experimental Probability with Two Independent Events: Math Journal FREEBIE
Here's a quick math journal entry for your middle school probability unit. Give your students six-sided dice, pennies, and whiteboards and let them explore what happens when they flip the coins and roll the dice. They can practice finding the experimental probability.Teach a mini lesson about the theoretical probability of two independent events: that you multiply the probability of each event to find the probability of BOTH events.Next, students are ready to work on the journal prompt. Expect a
Subjects:
Grades:
6th - 9th
Types:
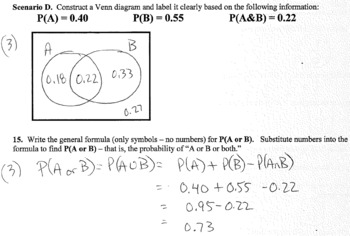
Statistics Quiz: Basic Probability (two versions)
Two versions of a quiz on basic probability concepts (answer KEYS provided). One quiz could be used as a practice/review. Includes sample space, independent events, mutually exclusive events, Venn diagrams, and the complement rule.
Subjects:
Grades:
9th - 12th
Types:
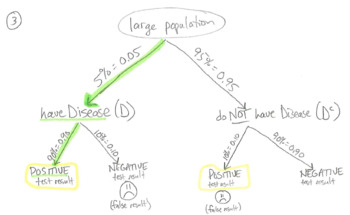
Probability Practice Packet (5 parts)
5-part probability practice packet (with answer KEY!). Students will practice the "rules and tools" of probability, to include the sample space, Venn diagrams, substitution into formulas, two-way tables, conditional probability, and tree diagrams.
Subjects:
Grades:
9th - 12th
Types:
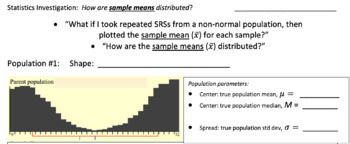
Statistics Investigation: the Central Limit Theorem:
This activity guides students as they investigate the wonderful website https://onlinestatbook.com/stat_sim/sampling_dist/. Through their observations, students can visualize the powerful and important fact known as the Central Limit Theorem (CLT).
Subjects:
Grades:
11th - 12th
Types:
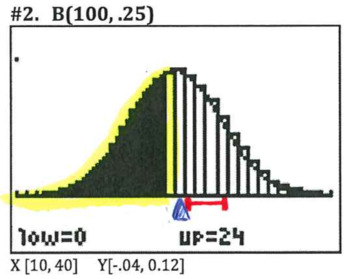
Statistics practice: Binomial Distributions & the Normal Distribution
Students will work through several binomial distributions in order to recognize when the binomial distribution can be approximated by the normal distribution. Examples and answer key include graphs to provide visual support.
Subjects:
Grades:
9th - 12th
Types:
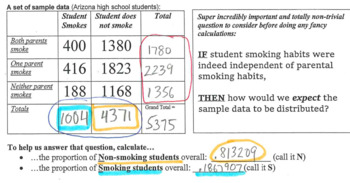
Statistics practice: chi-square test of independence
In the context of parent/student smoking habits, students practice the chi-square test of independence for a two-way table. Includes answer KEY.
Subjects:
Grades:
9th - 12th, Higher Education
Types:
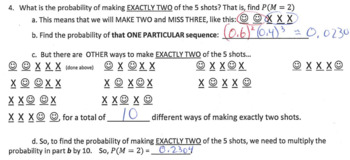
Statistics notes: Intro to the Binomial Distribution (w/practice problems)
Lead students through a clear, visually reinforced example to introduce the binomial formula, then practice solving problems using the binomial distribution. Answer KEY included.
Subjects:
Grades:
9th - 12th
Types:
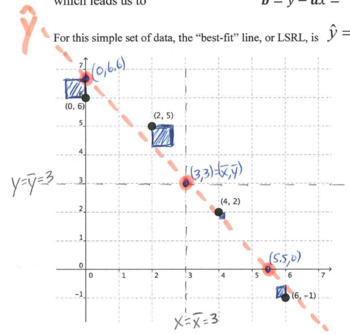
Statistics Lesson: Introduction to Correlation and Linear Regression
Guided notes for introducing correlation and linear regression, students will be actively engaged in the calculations and the visualization of the "least-squares regression line" (LSRL).
Subjects:
Grades:
10th - 12th
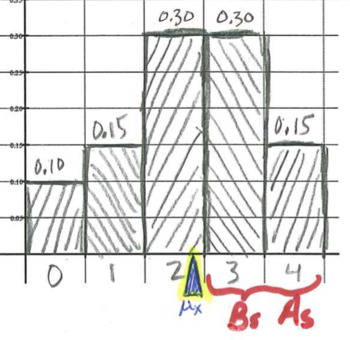
Statistics practice: Random Variables
Students work through the computation of the mean and variance of discrete random variables with reference to the probability histograms. After introductory examples, students work through several practice problems. Answer KEY provided!
Subjects:
Grades:
9th - 12th
Types:
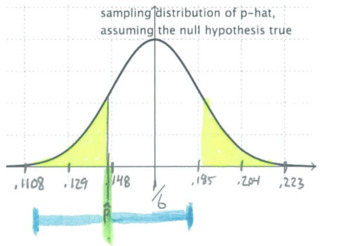
Statistics practice: Connecting significance tests and confidence intervals
Students work through inference about proportions in order to make a connection between the results of a significance test and the confidence interval. Rather than just telling students the relationship, this activity shows them! Answer KEY provided.
Subjects:
Grades:
11th - 12th
Types:
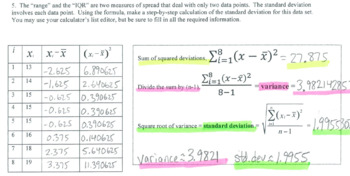
Standard Deviation & Resistant Statistics
By completing this two-page handout (answer KEY provided!), students work through the step-by-step process of calculating the standard deviation for two small datasets. In the process, students will note which statistics are resistant to outliers.
Subjects:
Grades:
9th - 12th
Types:
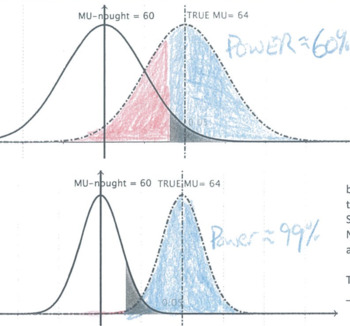
Statistics practice: Type I & II Error Probabilities (visually)
Students use two-color sketches to visualize and estimate (NOT calculate precisely) Type I and II error probabilities. This exercise helps students to see that statistical power increases with increased significance level, increased sample size, and increased effect size. Answer KEY provided!
Subjects:
Grades:
11th - 12th
Types:
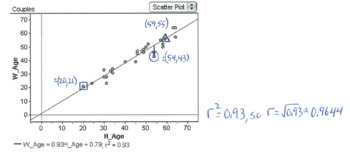
Statistics practice: Couples correlation
How do the concepts of correlation, linear regression, and residuals apply to a random sample of 30 married couples? We investigate two different quantitative variables: age and height. This activity gives students a chance to put the concepts into a practical context. Answer KEY provided!
Subjects:
Grades:
11th - 12th
Types:
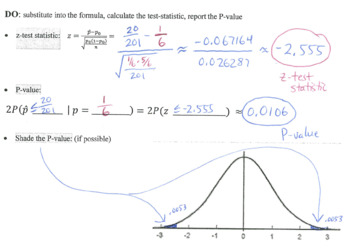
Tasty Statistics Lab: one-proportion Z
What proportion of the chocolate candies are green? Statistical inference with chocolate! Students will enjoy consuming their data set as they work through a significance test about one population proportion, followed by a confidence interval for the same parameter. After completing the "lab" in class, students have one additional inference task to complete on their own. Answers vary depending on the bag of candy, but I've provided a sample KEY based on a sample of n = 201 plain M&Ms.
Subjects:
Grades:
11th - 12th
Types:
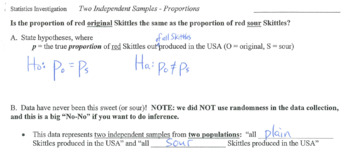
Tasty Statistics Lab: two-proportion Z
Are there more green sour candies than green sweet candies?Students will enjoy consuming their data set as they work through a significance test about two population proportions, followed by a confidence interval for the same parameter. After completing the "lab" in class, students have one additional inference task to complete on their own. Use my sample data or bring in your own candy, as you wish!
Subjects:
Grades:
11th - 12th
Types:
Showing 1-24 of 28 results


