10 results
High school statistics poster microsofts
Statistics In My World Project
This is a great project for students to do at the beginning of a HS statistics class. It will open their eyes to statistics in the media and provides real world interpretation of material learned the first couple weeks of class. The best part - You get lots of decorations for your wall and material to use as you progress through descriptive statistics!
Package includes instructions for teacher, including CCSM standards and objectives; student handout outlining specifics of the project; gradi
Subjects:
Grades:
11th - 12th
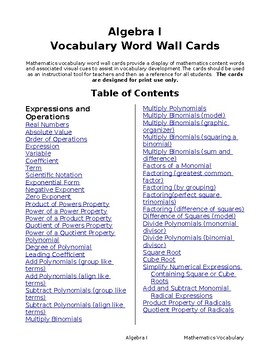
Algebra I Vocabulary Posters (110 Pages )
Looking for a quick and easy way to practice Math Vocabulary?These colorful and concise Posters and Flashcards are a great way to reinforce math concepts. Hang on a bulletin board and keep on a ring for reviewing.
Subjects:
Grades:
6th - 12th, Higher Education, Adult Education
Types:
Math Vocabulary Posters & Flash Cards for grade 8(Editable & fillable resource)
Looking for a quick and easy way to practice Math Vocabulary?These colorful and concise Posters and Flashcards are a great way to reinforce math concepts. Hang on a bulletin board and keep on a ring for reviewing.
Subjects:
Grades:
7th - 9th
Types:
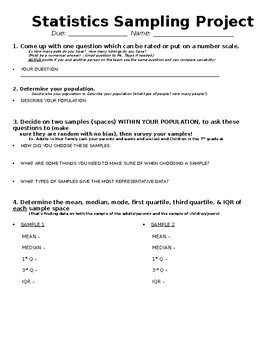
Statistics Sampling Project
An editable project where students will conduct a survey to conclude an outcome. Students will need to provide and explain their sample spaces, means, medians, modes, interquartile ranges, and IQRs, as well as construct dot plots and box plots on the data. The project comes with a rubric (broken down in points out of 100) on the project itself! I had students show work on a poster board, however, most of this work could be done on paper if you wished!
Subjects:
Grades:
5th - 10th
Types:
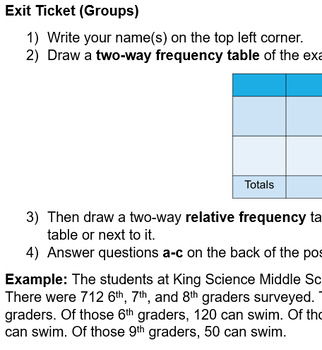
Two-Way Frequency and Relative Frequency Tables Group Posters Assignment
Learning Goal: I can read, create, and interpret two-way frequency tables and relative frequency tables. Organize students into groups of 2-3 give each student a piece of construction paper, markers/colored pencils, and one-half sheet of paper with the instructions and specific example to their group. I have incorporated 4 different examples of two way-tables they will create for both frequency and relative frequency. They will need to find some missing values on the chart not given. And then a
Subjects:
Grades:
9th - 12th
Types:
CCSS:
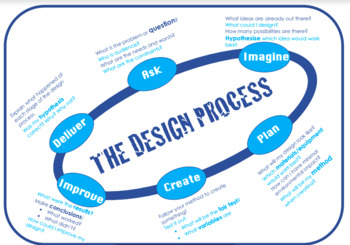
Design Process/Cycle
A design process/cycle to support students through their next science, design and technology or engineering unit of inquiry.
This resource can be edited to support all student's needs, curriculum links and teaching styles.
Each stage of the design process is aligned with questions to prompt students and promote deeper thinking.
Literacy links can be made with writing scientific experiments, procedural texts, and explanation texts. Numeracy links can be made to data collection, representation
Subjects:
Grades:
3rd - 10th
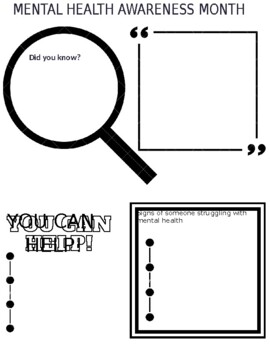
Mental Health Awareness Poster
A poster students can create to promote Mental Health Awareness around school. Fits perfectly with May Mental Health Awareness Month
Subjects:
Grades:
2nd - 12th, Staff
Types:
Box and Whisker Plots PPT Notes
Box and Whisker Plots, Power Point Presentation, Notes
Subjects:
Grades:
6th - 9th
Culminating Data Collection Project
This project is great for an end-of-semester culminating project. Students will design a study, gather data, then display and describe what they have discovered. As a bonus, you will receive lots of great displays for your classroom!
Subjects:
Grades:
10th - 12th
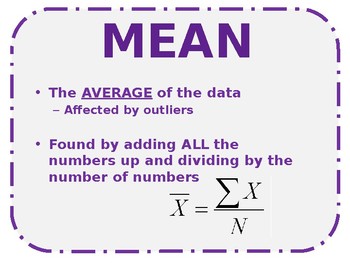
Central Tendency Posters
Posters to print out to put around the classroom to explain measures of central tendency (mean, median, mode, range, standard deviation, IQR)
Subjects:
Grades:
6th - 12th
Types:
Showing 1-10 of 10 results


