
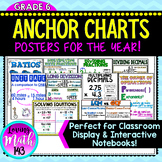
Mean, Median, Mode, Range Anchor Chart Poster


- PDF
What educators are saying
Also included in
 This Bundle of sixth grade math reference sheets are designed and aligned with 6th grade math! Fractions, Decimals, Ratios, Proportions, Expressions, Equations, Combining like terms, and more! Pretty much everything students need to know and understand for 6th grade. They make for excellent scaffolPrice $82.20Original Price $102.75Save $20.55
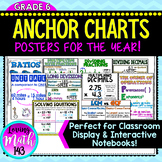 This Bundle of sixth grade math reference sheets are designed and aligned with 6th grade math! Fractions, Decimals, Ratios, Proportions, Expressions, Equations, Combining like terms, and more! Pretty much everything students need to know and understand for 6th grade. They make for excellent scaffolPrice $105.00Original Price $134.25Save $29.25
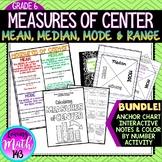 Mean, Median, Mode & Range Color By Number ActivityThis color by number activity is a fun and engaging way for students to practice calculating the measures of center including mean, median, mode and range. Students will solve 16 questions involving mean, median mode, and range then find their aPrice $5.00Original Price $7.00Save $2.00
Description
This middle school math anchor chart poster is a great tool to display in your classroom or distribute to your students to place in their interactive notebooks and/or binder. This anchor chart is great break down of mean, median, mode, and range. This anchor is aligned with the 6th and 7th grade Common Core standards students.
GET THIS ANCHOR CHART BY PURCHASING MY MATH ANCHOR CHART BUNDLE! CHECK IT OUT HERE!
***********************************************************************************************
HOW TO USE:
This anchor chart can be printed on a regular 8.5 x 11 inch printing paper and placed in student notebooks, or printed as a half-page making an excellent resource for students interactive notebook.
You can also scale the PDF file and print it on poster size paper and display it within your classroom. That is how I use my anchor charts.
***********************************************************************************************
WHATS INCLUDED:
★ Definition of Mean, Median, Mode and Range
★ Steps for each measure of center.
★ Example for each data set.
OTHER ANCHOR CHARTS YOU MAY ALSO LIKE:
★ Area of Polygon Formulas Anchor Chart Poster
★ Volume of a Rectangular Prism Anchor chart
★ Types of Angles Math Anchor Chart
GET THIS ANCHOR CHART BY PURCHASING MY MATH ANCHOR CHART BUNDLE! CHECK IT OUT HERE!
***********************************************************************************************
LICENSING TERMS: This purchase includes a license for one teacher only for personal use in their classroom. Licenses are non-transferable, meaning they can not be passed from one teacher to another. No part of this resource is to be shared with colleagues or used by an entire grade level, school, or district without purchasing the proper number of licenses.
COPYRIGHT TERMS: This resource may not be uploaded to the internet in any form, including classroom/personal websites or network drives, unless the site is password protected and can only be accessed by students.
