43 results
Statistics classroom decor microsofts
Statistics In My World Project
This is a great project for students to do at the beginning of a HS statistics class. It will open their eyes to statistics in the media and provides real world interpretation of material learned the first couple weeks of class. The best part - You get lots of decorations for your wall and material to use as you progress through descriptive statistics!
Package includes instructions for teacher, including CCSM standards and objectives; student handout outlining specifics of the project; gradi
Subjects:
Grades:
11th - 12th
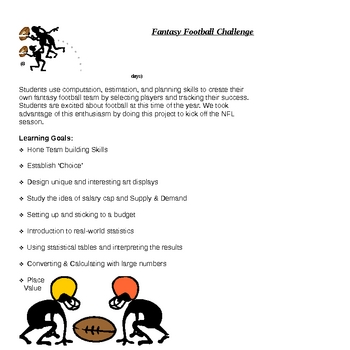
Are You Ready for Some FOOTBALL? (Middle School MATH Project)
Are you looking for a unique way to engage your students in authentic math concepts using real-world data that will blow their socks off? If so, this is your project! I have used this with eighth graders, but it would work well with any middle school performance indicators. This project involves so many performance indicators - estimation, rational numbers, scientific notation, number & word forms, budgeting, graphs, statistics, integers, media, cooperative learning, research, technology, vi
Subjects:
Grades:
5th - 8th
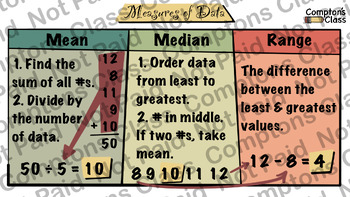
Compton's Class Data And Statistics 6th Grade Math Package
5 Anchor Charts that deals with Data and Statistics.
Subjects:
Grades:
6th
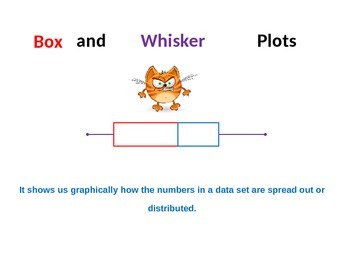
Box and Whisker Plot Analysis and Construction including Outliers
I use this MS PowerPoint presentation file to kickoff our study of Box Plots in my Pre-Algebra and Math I classes. It reviews in detail how to analyze a data set and to construct a Box Plot to accurately depict the distribution of the data (numbers). It is a totally animated ppt file and very easy for students to understand. Any of the ppt animations can be modified as desired by the presenter (teacher). It also includes 2 example problems for the students to complete at the end of the slid
Subjects:
Grades:
7th - 9th
CCSS:
Measurement and Data Common Core Math Vocabulary Posters- Grade 3
Common Core Math Vocabulary posters aligned with all Measurement & Data (3.MD) skills for Third Grade Math Common Core instruction. Includes 18 math terms, meanings and examples for each.
Terms included in this pack: area, bar graph, dimension, elapsed time, gram, hour, minute, kilogram, length, line plot, liquid volume, liter, mass, perimeter, pictograph, second, square unit, and width.
Please see my store for poster sets in each of the 4 other Common Core Math Strands for Third Grade! O
Subjects:
Grades:
3rd
Types:
Método Científico Kindergarten
Este paquete incluye carteles tamaño 8 1/2 x 11. Los mismos son coloridos y con imágenes atractivas y vocabulario para los estudiantes. Los carteles están listos para imprimir y laminar. Son perfectos para decorar el área de Ciencia. Las hojas de trabajo para los estudiantes incluye destrezas como: contar, identificar, recortar, colorear y más.El paquete incluye:1.Siete carteles con los Pasos del Método Científico2.Seis hojas para trabajar cada paso3.Un librito con los pasos del Método Científic
Subjects:
Grades:
K - 1st
Types:
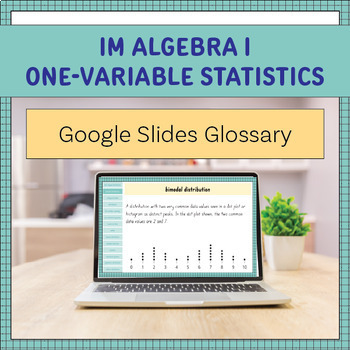
Illustrative Mathematics Algebra 1 One-Variable Statistics Glossary SLIDES
Please Note: I am in no way affiliated with Illustrative Mathematics. The mathematical content in this resource is not my own, I am merely providing a formatted version of the curriculum materials for use within your own classroom, which is licensed under the Creative Commons. Within my own classroom, I use the Kendall Hunt version of Illustrative Mathematics.This is a Google Slides glossary for Illustrative Mathematics Algebra 1 Unit 1: One-Variable Statistics. The terms have been taken from th
Subjects:
Grades:
8th - 11th
CCSS:
Winter Themed Holiday Glyphs
These themed holiday glyphs include an elf, snowman, and reindeer. Use these glyphs as a single lesson on data collection, or refer back to them again and again. These engaging glyphs address skills like following instructions, collaboration, data collection, and analytical skills. Whether you are a seasoned vet with glyphs or trying them for your first time these FULLY CUSTOMIZABLE glyphs can be altered to fit the needs of any class or grade.
Subjects:
Grades:
Not Grade Specific
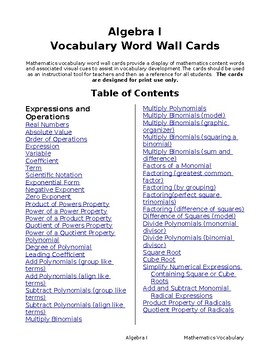
Algebra I Vocabulary Posters (110 Pages )
Looking for a quick and easy way to practice Math Vocabulary?These colorful and concise Posters and Flashcards are a great way to reinforce math concepts. Hang on a bulletin board and keep on a ring for reviewing.
Subjects:
Grades:
6th - 12th, Higher Education, Adult Education
Types:
Math Vocabulary Posters & Flash Cards for grade 8(Editable & fillable resource)
Looking for a quick and easy way to practice Math Vocabulary?These colorful and concise Posters and Flashcards are a great way to reinforce math concepts. Hang on a bulletin board and keep on a ring for reviewing.
Subjects:
Grades:
7th - 9th
Types:
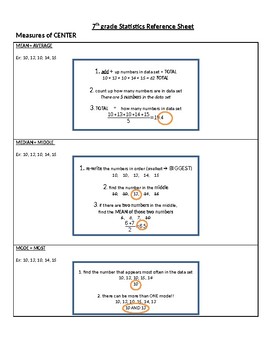
7th grade Statistics - Unit Reference
2018-2019 7th grade statistics unit reference guide. Supporting mastery of grade level objectives. Students will be able to define what makes a strong statistical sample, students will compare related data sets to draw conclusions about past trends and make predictions for the future, students will represent data sets visually through box plots, histograms, and other graphical tools, and utilize these in combination with numerical statistical measures in order to support their conclusions and
Subjects:
Grades:
6th - 8th
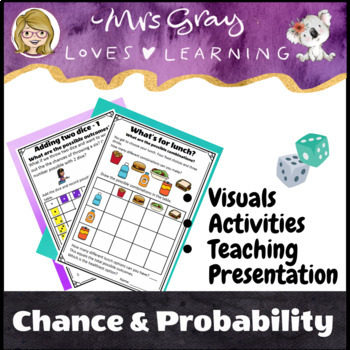
Chance and Probability Introduction
Make teaching probability fun with these engaging, visual and hands-on probability activities! Here is a low prep resource that will complement your program and help you teach chance and probability with presentations, visuals, vocabulary cards and activities. It introduces probability language including 12 word cards - certain, very likely, likely, possible, even chance, fifty-fifty, unlikely, very unlikely, impossible, will happen, might happen and won’t happen. You can pick the cards that are
Subjects:
Grades:
3rd - 4th

Using Statistics in Marketing
A wonderful, common core application of how statistics are manipulated in the real world!
Students will use a data sheet to compare the nutrition facts of various products from a few popular fast food chains. They will be given a product/company to market for, and use data provided to create a claim to do this. They will justify their claim using evidence from the data, and design an advertisement for this product/company.
Subjects:
Grades:
6th - 9th
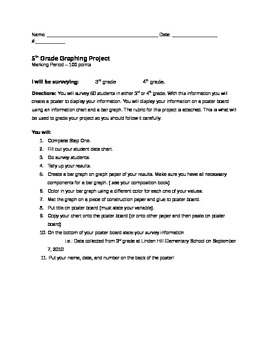
Graphing and Surveying Project
A graphing and Surveying Project for students to get a better idea of how to create different types of graphs. I have used this with fourth and fifth grades and it was fantastic!
The attachment includes: Step by Step directions for the project, a brainstorming sheet, a chart to take the survey on, a written response sheet, and a rubric to grade students.
Graphing and Surveying Project is licensed under a Creative Commons Attribution 3.0 United States License.
Subjects:
Grades:
3rd - 6th
Types:
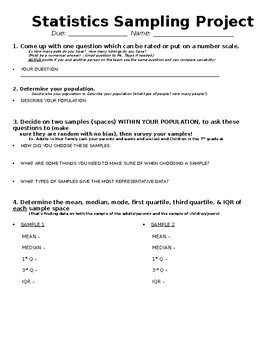
Statistics Sampling Project
An editable project where students will conduct a survey to conclude an outcome. Students will need to provide and explain their sample spaces, means, medians, modes, interquartile ranges, and IQRs, as well as construct dot plots and box plots on the data. The project comes with a rubric (broken down in points out of 100) on the project itself! I had students show work on a poster board, however, most of this work could be done on paper if you wished!
Subjects:
Grades:
5th - 10th
Types:
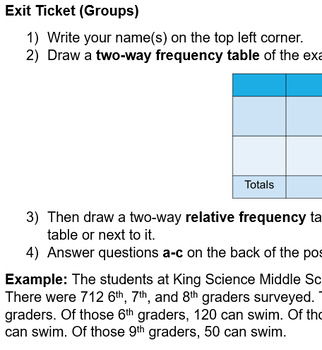
Two-Way Frequency and Relative Frequency Tables Group Posters Assignment
Learning Goal: I can read, create, and interpret two-way frequency tables and relative frequency tables. Organize students into groups of 2-3 give each student a piece of construction paper, markers/colored pencils, and one-half sheet of paper with the instructions and specific example to their group. I have incorporated 4 different examples of two way-tables they will create for both frequency and relative frequency. They will need to find some missing values on the chart not given. And then a
Subjects:
Grades:
9th - 12th
Types:
CCSS:
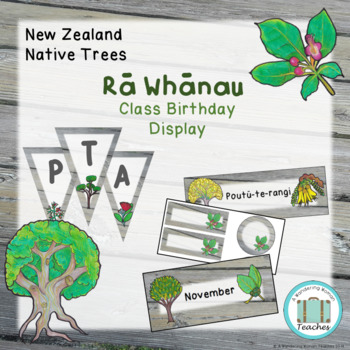
Class Birthday Display - Native New Zealand Tree
Do your kids struggle with getting the months of the year in order? In English? In Te Reo? Do they know when their birthday is? Are you setting up a birthday display in your classroom?This display will help your kids to get their months in order and know when their and their friends birthdays are. Simply print off the months and the number of matching date circles you need for each month, laminate and add their names and birthdays on and your ready to go! This stunning selection of Native New Z
Subjects:
Grades:
Not Grade Specific
Types:
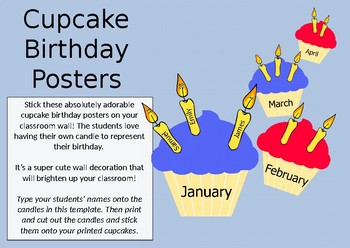
Superhero Colored Birthday Posters!
Includes:
-12x superhero colored cupcake posters printable on a4 paper (1 for each month of the year)
-Editable candle template that you can type your students' names and date of birth onto.
- Blank candles that the students can color themselves
Great for a math data lesson!
Stick these absolutely adorable superhero colored birthday posters on your classroom wall to go with your superhero theme!
Subjects:
Grades:
PreK - 4th
Types:
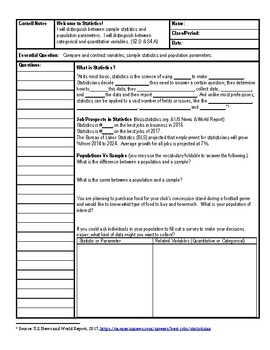
Statistics Sampling Methods Unit: Lessons, Notes and Wordwalls
This zip file includes powerpoints and cornell notes for the following topics in my first unit covering Sampling Methods and Study design for High School Statistics (not AP which I also teach).A1 Statistics Basics plus wordwall vocabulary plus a vocabulary foldableA2 Why Randomize <- not included here. It's a free download.A3 Sampling Methods plus wordwall vocabularyA4 Types of Studies plus wordwall vocabularyA5 Designing studies plus wordwall vocabularyHere's my class website with my video
Subjects:
Grades:
9th - 12th
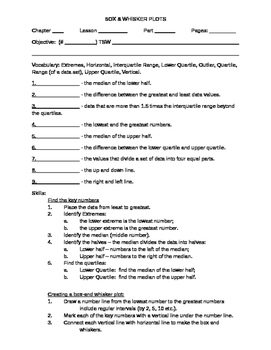
BOX & WHISKER PLOT NOTES & VOCABULARY
OUTLINE: with vocabulary and easy to follow steps.
Subjects:
Grades:
6th - 8th
Types:
Design Process/Cycle
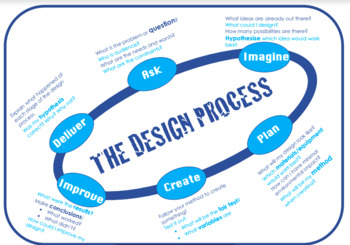
A design process/cycle to support students through their next science, design and technology or engineering unit of inquiry.
This resource can be edited to support all student's needs, curriculum links and teaching styles.
Each stage of the design process is aligned with questions to prompt students and promote deeper thinking.
Literacy links can be made with writing scientific experiments, procedural texts, and explanation texts. Numeracy links can be made to data collection, representation
Subjects:
Grades:
3rd - 10th
Mental Health Awareness Poster
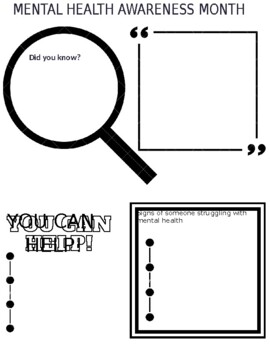
A poster students can create to promote Mental Health Awareness around school. Fits perfectly with May Mental Health Awareness Month
Subjects:
Grades:
2nd - 12th, Staff
Types:
Data Landmark Posters
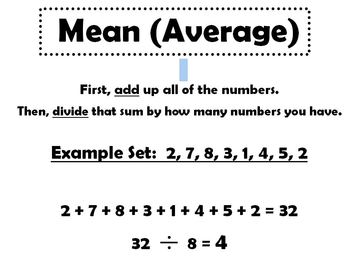
Teachers can print out these posters when they are teaching mean (average), median, mode, range, maximum, minimum. They show the basic meaning for each word and an example on each poster. They can be printed on 8.5 X 11 size for small group teaching, or be enlarged for posting on the walls. They are helpful reminders for students who have a hard time keeping of track of what each one means.
From Illini Teacher
Subjects:
Grades:
3rd - 5th
Showing 1-24 of 43 results


