8 results
2nd grade statistics research
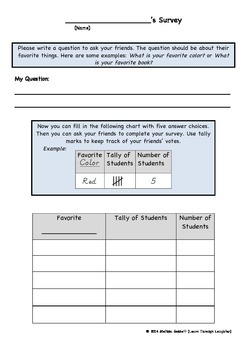
Student Created Survey and Bar Graph
INQUIRY BASED LEARNING! This activity gives students the chance to answer their own burning questions. Examples can include the following: What is the favorite video game of my friends? Do more people in this class like pizza or hamburgers? Which football team is the most popular in this class?
Students are walked through the steps of selecting a topic, gathering data, inserting it into a bar graph, and analyzing the results. It is interesting to see the topics they dream up! This activity can
Subjects:
Grades:
2nd - 3rd
Types:
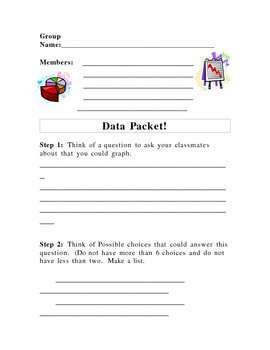
Circle Graph Project
This is a project for pairs or teams of students. They choose a question to graph by coming up with up to 6 possible responses. Then they ask their classmates and turn their answers into a circle graph.
Subjects:
Grades:
2nd - 6th
Types:
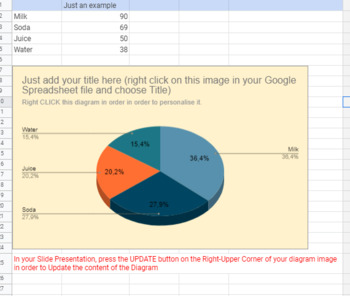
3D Editable Radial Diagram - Google Slide and Google Sheet files
With this 3D Editable Radial Diagram you can easily prepare your diagram presentations and you can use them in almost any activity. Be creative!Useful for any teacher that wants to explain and demonstrate what is a diagram, why and when people are using it. Radial Diagrams help you and your students visualize the results, learn fractions, etc.This is an editable Radial Diagram. You will get 1 Google Spreadsheet File and 1 Google Slide file. You will edit all the data in the Spreadsheet and you w
Subjects:
Grades:
1st - 12th, Higher Education, Adult Education, Staff
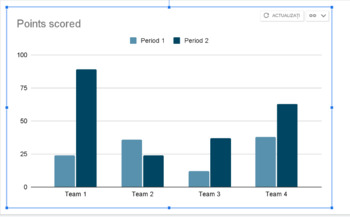
Editable Double Column Chart Diagram for Digital Learning - Google Slide
With this Editable Double Column Chart Diagram for Digital Learning you can easily prepare your column chart diagram presentations and you can use them in almost any activity. Be creative!Useful for any teacher that wants to explain and demonstrate what is a column chart diagram, why and when people are using it. Column chart Diagrams help you and your students visualize the results, read diagram charts, etc.This is an editable Column Chart Diagram. You will get 1 Google Spreadsheet File and 1 G
Subjects:
Grades:
1st - 12th, Higher Education, Adult Education, Staff
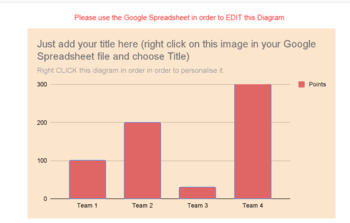
Editable Chart Diagram - One Column - for Digital Learning - Google Slide
With this Editable One Column Chart Diagram for Digital Learning you can easily prepare your column chart diagram presentations and you can use them in almost any activity. Be creative!Useful for any teacher that wants to explain and demonstrate what is a column chart diagram, why and when people are using it.Column chart Diagrams help you and your students visualize the results, read diagram charts, etc. Very helpful for math activities and statistics.This is an editable Column Chart Diagram. Y
Subjects:
Grades:
1st - 12th, Higher Education, Adult Education, Staff
Types:
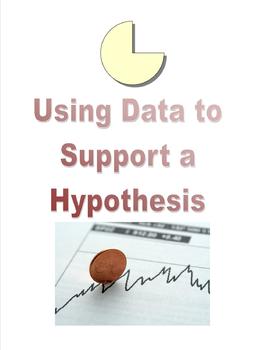
Using Data to Support a Hypothesis
In this math challenge, students must create a hypothesis and then collect and display data to support their hypothesis!
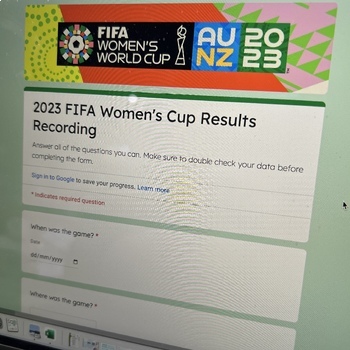
2023 FIFA Women's World Cup Data Recording Google Form
Let's celebrate the FIFA Women's World Cup and engage students in gathering data. This Google Form gathers:- Game results- Attendance at the game/Ticket sales- Goals- Attempted goals- Cards- Why cards were givenUse this data to further Statistical Investigation skills and support rich real-world Maths learning. This is designed to work with the 2023 FIFA Women's World Cup Data Recording Google Form, 2023 FIFA Women's World Cup Data Recording Template and 2023 FIFA Women's World Cup Goal Line Gra
Subjects:
Grades:
2nd - 12th
Types:
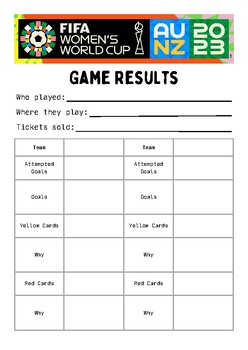
2023 FIFA Women's World Cup Data Recording Template
Let's celebrate the FIFA Women's World Cup and engage students in gathering data. This template gathers:- Game results- Attendance at the game/Ticket sales- Goals- Attempted goals- Cards- Why cards were givenUse this data to further Statistical Investigation skills and support rich real-world Maths learning. This is designed to work with the 2023 FIFA Women's World Cup Data Recording Google Form, 2023 FIFA Women's World Cup Data Recording Template and 2023 FIFA Women's World Cup Goal Line Graph
Subjects:
Grades:
2nd - 12th
Showing 1-8 of 8 results


