18 results
Graphing projects for Microsoft Excel
Lucky Charms Cereal Data Analysis and Graphing Project St. Patrick's Day
Looking for a way to review data analysis and graphing skills without it being a bore? This Lucky Charms Cereal Data Analysis and Graphing Project is a fun activity to incorporate in March for St. Patrick's Day, but of course it works at any time of the year in a graphing unit or in a math-integrated unit. Your students will smile when you whip out the box of Lucky Charms and tell them that they are to pretend they are the Quality Control Department at the Cereal Company! This activity is fun an
Subjects:
Grades:
6th - 8th
Types:
NGSS:
MS-ETS1-4
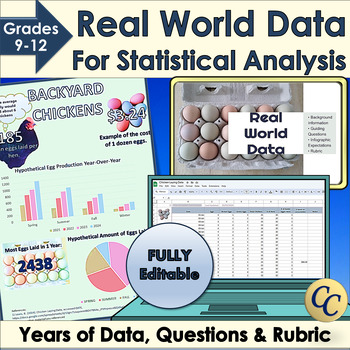
Real World Data for Statistical Analysis and Infographic Project
Give your students access to real world data for your statistical analysis unit or data literacy! Dive into statistics with Microsoft Excel™ or Google Sheets™ and years of data. Learn how to use standard deviation, mean or median to interpret data. Choose the best graphs to display conclusions in an infographic. Works great for science fairs! ✔ Includes an infographic project! (Template, expectations, and rubric). ✔ Everything is fully editable and you and your students can even use the images
Grades:
9th - 12th
Types:
CCSS:

Water Balloon Catcher Project - Data and Graphing - Mathematics
Transform your maths classroom into a dynamic hub of learning with this captivating data and graphing project! Designed for upper primary/middle school students, this hands-on and inquiry-based activity ensures an immersive experience in mastering data interpretation, chart creation, and understanding the role of data and graphs in advertising.In this engaging project, students will: Explore Data: Collaborate in teams to design and construct a Water Balloon Catcher using recycled materials, each
Subjects:
Grades:
5th - 9th
Types:
Excel Graphing Summer Fun with Digital Student Directions
The last marking period of the school year can be a challenging time to keep students engaged…they’re thinking about summer…you’re thinking about summer…#embraceitThis Summer Fun Excel project can be a perfect way to:* integrate technology* extend and enrich a math topic of study* introduce students to creating sheets and charts using ExcelProject file includes:* teacher notes/ classroom management suggestions* digital survey, using a Google Form, to collect summer activities data* digital stude
Subjects:
Grades:
3rd - 6th
Types:

Stock Market Project - 7.SP.1, 7.SP.4, 7.SP.6
Students will pick a stock to research the tendencies over the previous six months. They will analyze the trends, the central tendencies, and predict the stock's future worth based off of that data.
There is an excel spreadsheet to input the data for the stock, which will then create a graph for the student from its data. The student will need to then adjust the graph to their needs however.
Subjects:
Grades:
6th - 8th
Types:
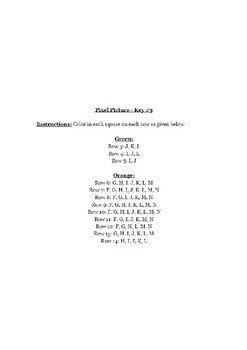
Halloween Pixel Art Excel/Google Sheets
Microsoft Excel activity to use upper elementary or middle school students? This great lesson incorporates art as students learn the basics of Microsoft Excel.These are also fun lessons to use if you just need something for a one day lesson.
This download includes:
1. Teacher & Student Resources
2. Excel Template for Pixel Art
3. Legends and Sample Pictures for 3 Halloween Pictures
When completed let students make their own pictures, they will love it!
I've used this with 6th and 7th gra
Subjects:
Grades:
5th - 9th
Types:
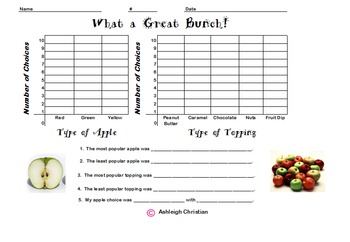
Third Grade Graphs with Tally Chart
This product is a collection of graphs to teach children how to take a poll and graph the information. There are also comprehension questions. Graphs about age, M & M's, favorite pets, apples and favorite cookies. Enjoy!
Subjects:
Grades:
3rd
Types:
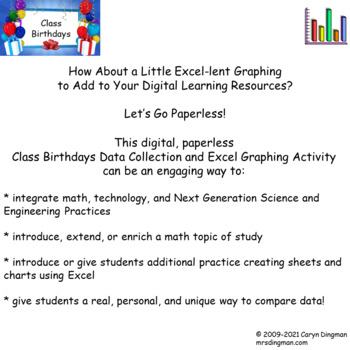
Excel Graphing Classroom Birthdays with Digital Student Directions
Give your students a chance to get to know their classmates, comparing their birthday celebration data in a way that's real and relevant!This Class Birthdays Excel Project can be an engaging way to:* integrate technology* introduce, extend, or enrich a math topic of study* introduce students to creating sheets and charts using ExcelThe classroom-tested product file includes:* class survey, using Google Forms, to find out the month in which each student celebrates a birthday* student project dire
Grades:
3rd - 5th
Types:
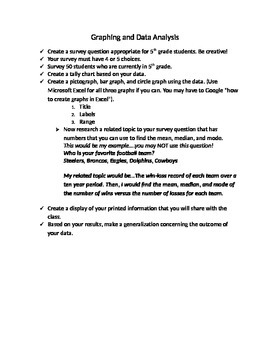
Fifth Grade Graphing and Data Analysis
Students will work together to come up with a survey question that has 4 or 5 choices. They will actually perform the survey and then use the data received to create a pictograph, bar graph, and circle graph using the data. They will use Microsoft Excel to create the graphs.
Subjects:
Grades:
5th - 7th
Types:
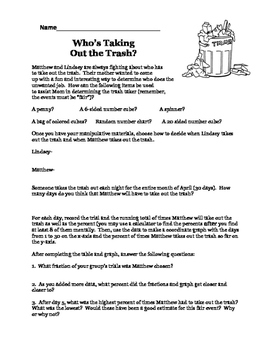
Who's Taking Out the Trash? An Experimental Probability Activity
When deciding the probability of an event through experimentation, how many trials are enough? 10? 1,000? 1,000,000??? This activity is a cooperative grouping activity that focuses on just that. The pre-lesson set up reels the students in. The activity engages them. The manipulative materials involve them. An Excel extension is also available to combine the results of multiple groups. Through this activity, students really see how more trials leads to a better understanding of the true pr
Subjects:
Grades:
6th - 8th
Types:
CCSS:
Excel Graphing Halloween Fruit Snacks with Digital Student Directions
How About a Little Excel-lent Graphing to Add to Your Digital Learning Resources?This digital, paperless Halloween Fruit Snacks Data Collection and Excel Graphing Activity can be an engaging way to:* integrate math, technology, and Next Generation Science and Engineering Practices* extend and enrich a math topic of study* introduce or give students additional practice creating sheets and charts using Excel* give students a real, personal, and unique way to compare data that’s fun and delicious!
Subjects:
Grades:
3rd - 6th
Types:
Excel Graphing Lucky Charms Marshmallows
Give your students a real-world chance to compare Lucky Charms cereal marshmallow data in a way that's personal and unique!This Lucky Charms Marshmallows Excel Project can be an engaging way to:* integrate technology* introduce, extend, or enrich a math topic of study* introduce or give students additional practice creating sheets and charts using Excel The classroom-tested product file includes:* student project directions sheet, in checklist form* rubric to score each completed graph* sample b
Grades:
3rd - 6th
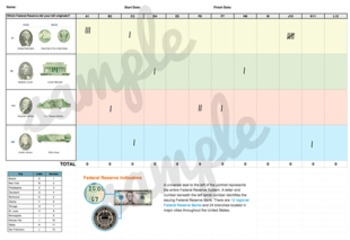
Which Federal Reserve Did My Bill Come From?
A tally sheet that is a great pre-cursor to any field trip or discussion on the Federal Reserve. Kiddos can learn how to identify which reserve the bill in thier wallet/purse comes from and over a period of time (determined by you), can tally where the bills are from that they and their parents use for transactions. Great project for students learning about money or economics!Comes as an Excel document, but you can export that into a PDF to print for your student where they can complete with a
Subjects:
Grades:
K - 12th
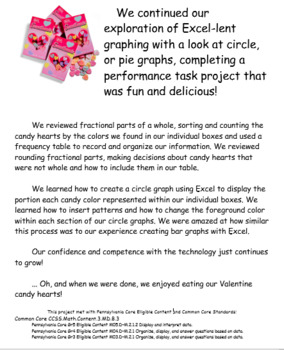
Excel Graphing Valentine Conversation Hearts
Explore Excel circle graphing with a Valentine's Day project that's fun and delicious!Students will create circle, or pie graphs using Excel to display Valentine candy hearts' data. Fractional parts of a whole will be reviewed and discussed as part of the project. Project file includes sample bulletin board display poster, project directions in individual student checklist form, and rubric to grade the finished graph.Project file student directions have been updated for Excel 2016.This project w
Grades:
3rd - 6th
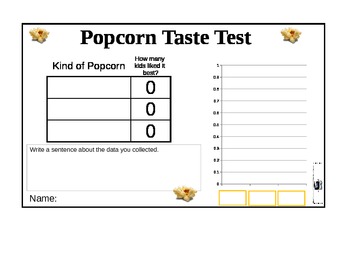
Graphing Flavors of Popcorn
This is an Excel spreadsheet designed for use with first graders. Students sample 3 types of popcorn (butter & salt, chocolate, and candied popcorn), then a class vote is done. Students move the labels onto the data chart and graph. There is space for students to type in the votes and a sentence about their data.
Grades:
K - 1st
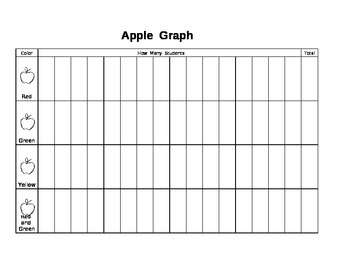
Apple Graph for Johnny Appleseed's Birthday.
Students bring in their favorite color apple and graph the results. Included in this attachment is a ready-made parent letter and a ready-to-use graph for students to graph the class results. Use this lesson in the fall (September 26th is Johnny Appleseed's birthday) to introducing graphs and math language like "more than," "less than," "equal," etc.
Subjects:
Grades:
PreK - 3rd
Types:
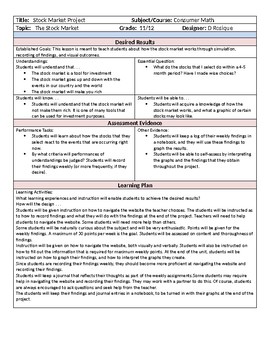
Stock Market Project plus Graphing and Data Recording
This is a project that I use in my classroom to teach students how the stock market works and what the data looks like after a period of at least three months. Students record data findings weekly, and after a period of at least twelve weeks, the graph their findings. This is useful in illustrating how the stock market goes up and down with the events that are happening throughout the world.
Subjects:
Grades:
11th - 12th
Types:
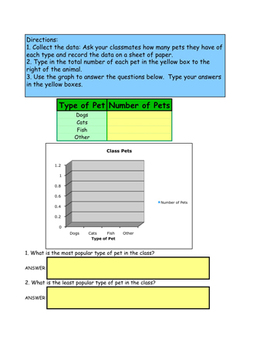
Class Pets: Collecting Data and Reading Graphs in Excel for Primary Grades
Save this file to a shared drive so that all students can access it on their own computer. This file contains two pages in Microsoft Excel. The tabs at the bottom allow you to click back and forth between the two pages. For each student in your class, print a copy of the Data Collection sheet. Give students time to survey their classmates and record the data on the collection sheet. Students will enter the data into the spreadsheet which will automatically create a graph on the page. Students wi
Showing 1-18 of 18 results


