29 results
Statistics projects for Microsoft Excel
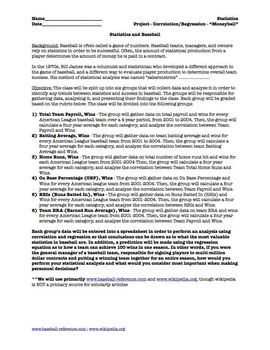
Statistics Correlation and Regression Project for Movie "Moneyball" (5 day)
Prerequisite: Correlation and Regression (Linear). This is a project that divides a statistics class into 6 groups and students do ACTUAL data collection from given websites and they perform their OWN ANALYSIS. They will use computers/internet/excel/spreadsheets/graphing calculators to evaluate correlation. If you have interest in baseball and statistics, this is a great project to get the class interested, and covers about 5 days, plus you can watch the movie "Moneyball" afterwards as a reward.
Subjects:
Grades:
10th - 12th, Higher Education, Adult Education
Types:
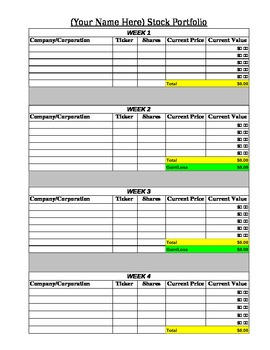
Stock Market Portfolio Tracking Spreadsheet
This document is an Excel spreadsheet which has already been formulated for students to use as part of a Stock Market unit. As students research and track their stocks, they will enter their data into the spreadsheet and their profit/loss will be automatically calculated along with a graph for students to analyze their results.
Subjects:
Grades:
4th - 8th
Types:
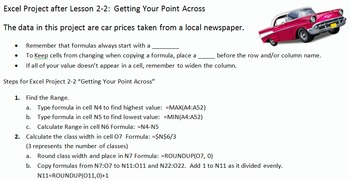
Excel Projects for Statistics Frequency Distributions and Charts
This file contains three different projects with solutions and a quick reference card for students. It correlates to Bluman's Elementary Statistics textbook.
First is an Introduction to Excel. There is an example, guided practice and then 4 Projects. The instructions are on each sheet. The topics covered are: basic editing and formatting, beginning charts, beginning formulas, such as SUM and AVERAGE, and calculations. There is an editable grading rubric for this project. The Preview file
Subjects:
Grades:
8th - 11th, Higher Education, Adult Education
Types:
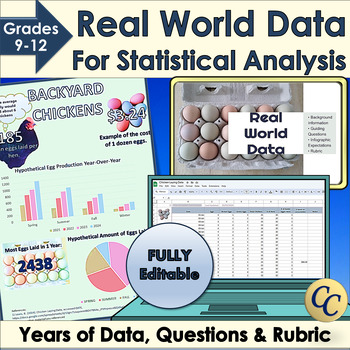
Real World Data for Statistical Analysis and Infographic Project
Give your students access to real world data for your statistical analysis unit or data literacy! Dive into statistics with Microsoft Excel™ or Google Sheets™ and years of data. Learn how to use standard deviation, mean or median to interpret data. Choose the best graphs to display conclusions in an infographic. Works great for science fairs! ✔ Includes an infographic project! (Template, expectations, and rubric). ✔ Everything is fully editable and you and your students can even use the images
Grades:
9th - 12th
Types:
CCSS:
Presidential Data Analyst Math Project | Excel | Presentations | Presidents Day
Elevate your Presidents' Day lesson plans with this comprehensive Presidential Data Analysis Math Project, designed to engage students in a deep exploration of U.S. presidential history through mathematical analysis. This invaluable resource provides educators with everything they need to guide their students through a dynamic and informative project that combines historical research with mathematical concepts.**Key Features:**1. **Thematic Relevance:** - Aligned with Presidents' Day, this o
Subjects:
Grades:
7th - 10th

Water Balloon Catcher Project - Data and Graphing - Mathematics
Transform your maths classroom into a dynamic hub of learning with this captivating data and graphing project! Designed for upper primary/middle school students, this hands-on and inquiry-based activity ensures an immersive experience in mastering data interpretation, chart creation, and understanding the role of data and graphs in advertising.In this engaging project, students will: Explore Data: Collaborate in teams to design and construct a Water Balloon Catcher using recycled materials, each
Subjects:
Grades:
5th - 9th
Types:

Stock Market Project - 7.SP.1, 7.SP.4, 7.SP.6
Students will pick a stock to research the tendencies over the previous six months. They will analyze the trends, the central tendencies, and predict the stock's future worth based off of that data.
There is an excel spreadsheet to input the data for the stock, which will then create a graph for the student from its data. The student will need to then adjust the graph to their needs however.
Subjects:
Grades:
6th - 8th
Types:
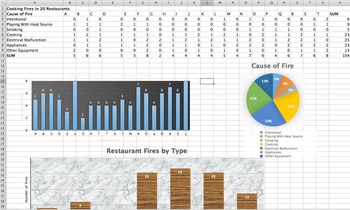
Statistics Project Unit 3 Spreadsheets Mean Median Mode Std. Deviation (2 day)
This is a 1-2 day project aimed at introducing a statistics class to Excel (or Numbers) who are familiar with Pie Charts, Bar Charts, Measures of Central Tendency, and Standard Deviation. The students will input data (included) into Excel (on fires in restaurants), form their own Bar Charts and Pie Charts, and be able to input formulas into the Excel to automatically calculate statistics. Students will be given the opportunity to explore different charts and design their charts to make them colo
Subjects:
Grades:
9th - 12th, Higher Education, Adult Education
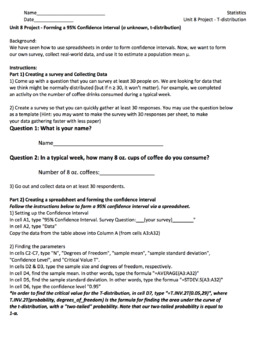
Statistics Unit 8 Project - Surveys, Confidence Intervals, Spreadsheets (3 days)
This is an end-of-unit project with Confidence Intervals for a Statistics class. Students will work together to create a survey, gather real-world data, create a spreadsheet, perform a confidence interval analysis to estimate the population mean μ, and create a Powerpoint presentation to present to class. The Product includes: Instructions for studentsTeacher instructions Excel spreadsheet with samplesGrading Rubric *The topics covered are Confidence Intervals, T-distribution, spreadsheets, pres
Subjects:
Grades:
10th - 12th, Higher Education
Types:
CCSS:
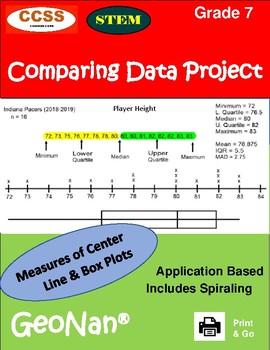
7th Grade Comparing Data Project
Project-Based Learning! Apply the concepts of data analysis. Students will develop Line Plots and Box Plots with calculations for mean, median, upper and lower quartiles, mean absolute deviation, and range. Students become sports analysts and make comparisons between two teams. This 26-page booklet includes Lesson Plans, Activity & Key, Excel Workbook Guide, WebQuest, Word Search & Key, and the Comparing Data Project with Rubric. Everything needed for a Real-World Application of the G
Subjects:
Grades:
6th - 8th
Types:
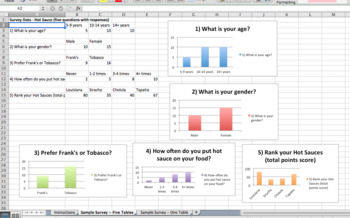
Statistics Unit 1 Project - Gathering Data (3 days)
This is an end-of-unit project for a Statistics class. It is introductory into survey methods, gathering data, using spreadsheets to organize data, creating charts, and presenting findings to the class. The Product includes: Instructions for studentsTeacher instructions for guidance on use and editingExcel spreadsheet with samplesGrading Rubric *The topics covered are survey methods - simple random, stratified, convenience, cluster, systematic - spreadsheets, charts, and presentations. The docum
Subjects:
Grades:
10th - 12th, Higher Education
Types:
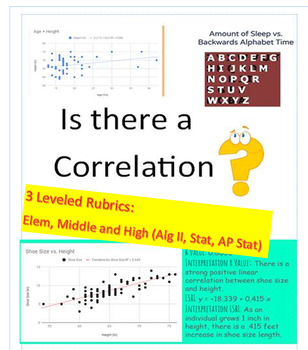
Correlation? Data Project (3 Rubrics_Elem/Middle School/ AP Stats) EOY
Get ready to supercharge your students' data analysis skills with this dynamic project! Perfect for end of year or semester project. In this engaging activity, students will have the exciting opportunity to collect their own data through surveys, online research, or real world data sets. They will then dive deep into the world of statistics as they determine if there is a correlation between two variables. With three different leveled rubrics, this project is perfect for students of all ages an
Subjects:
Grades:
Not Grade Specific
Types:
CCSS:
Also included in: High School Math Projects (Algebra II and Statistics) STEM No prep
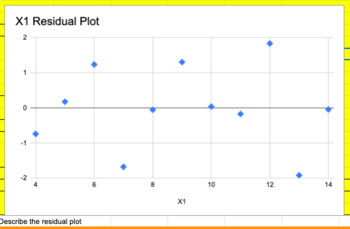
AP Statistics LSRL Activity - Is LSRL appropriate?
Just because r is strong, does that mean you can use a LSRL?This activity guides students to use excel/ google sheets to1. Graph scatterplots with trend lines/ labels2. Use XLMinter ToolPak to identify key statistics in linear regression analysis3. Identify and interpret R, R^2, S4. Graph and see residual plots7. Compare key statistics in four data sets to determine which is most appropriate to use LSRL.This file was originally created as a google sheet.A sample answer key is included.There are
Subjects:
Grades:
11th - 12th
Types:
CCSS:
Reasoning and Problem Solving in Math - A Student Workbook
This is a student-centered workbook that reviews students’ application of concepts in mathematics such as:PercentagesRepresenting data as bar charts or pie chartsWorking out combinations of two or three itemsUsing area and perimeterUse models to solve problemsFractionsThe main concept addressed in this workbook is Combinatorics. Students are encouraged to find combinations using some sort of reasoning using mathematical models without being introduced to the algorithm or calculators. This is bel
Subjects:
Grades:
6th - 8th
Types:
mean, median, mode, and range Unit
Multiple classroom activities working towards finding the mean, median, mode, and ranges. Offers short projects, as well as, long range projects.
Subjects:
Grades:
4th - 8th

Bell Curve versus Boxplot
Students complete a formative assessment using data from Los Angeles County's Homicides and Gang-Related Homicides for the years 1985 through 2001. Students should know how to determine what data set to choose for each type of graph. Objectives included in the project are:
Create a bell curve and label properly.
Create a boxplot in Excel and label properly.
Determine z-scores for 4 years.
Determine percentages above and below a "test value".
Write a 2 page analysis.
Answer Key (Excel Spreadsh
Subjects:
Grades:
11th - 12th
Types:

Sports or Movies Excel Mini Project
Students will have the opportunity to choose between researching movies or sports players. They will use the data that they find to practice the basics of Excel:
-typing in cells
-formatting cells (italicized, bold, rounding, etc.)
-using basic functions for calculations (minimum, maximum, average)
-creating a graph
Check out my other personal finance products:
Cars and Colleges Excel Mini ProjectCritiquing BudgetsDeceptive Advertising ProjectIdentity Theft ProjectNo Money Mo Problems Credit
Subjects:
Grades:
9th - 12th
Types:
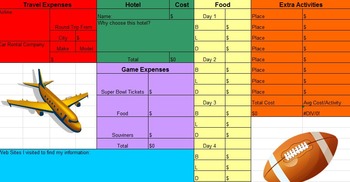
Virtual Vacations in Excel
Students get online and search the real life costs to take a vacation. Spreadsheets can be modified to fit your needs. Students can then discuss classroom mean costs.
Subjects:
Grades:
5th - 8th
Types:
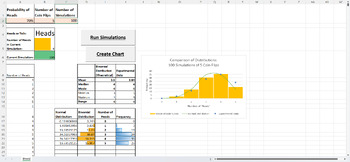
Excel Probability/Statistics Task - Biased Coin Simulator
Allow students to explore probability distributions and statistical sampling in real-time with this Biased Coin Simulator Task. Students will also develop strong ICT skills as they get the opportunity to create and test their own copy of this simulator in a Microsoft Excel Macro-Enabled Workbook.The SimulatorIn the Biased Coin Simulator the probability of the coin landing on heads can be adjusted to any value between 0 and 1. The Bernoulli trial of flipping the coin is repeated (the simulator ca
Grades:
9th - 12th
Types:
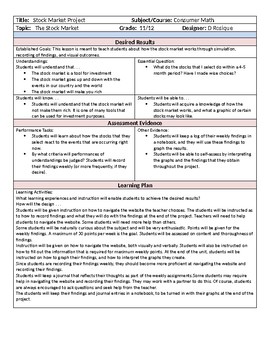
Stock Market Project plus Graphing and Data Recording
This is a project that I use in my classroom to teach students how the stock market works and what the data looks like after a period of at least three months. Students record data findings weekly, and after a period of at least twelve weeks, the graph their findings. This is useful in illustrating how the stock market goes up and down with the events that are happening throughout the world.
Subjects:
Grades:
11th - 12th
Types:

Overview of Mr. Bill's Store
I learned many years ago that the most effective way of keeping math engaging for students is through SELECTIVE PROBLEM SOLVING. All kinds of problem solving...not just traditional "solve this equation" problems. I will offer teachers ideas for keeping kids excited about math. Such as...building a probability distribution of outcomes from throwing dice...constructing a pendulum that will draw Lissajous figures...constructing a Foucault pendulum...how to do interesting large-scale astronomical
Subjects:
Grades:
5th - 12th
Types:
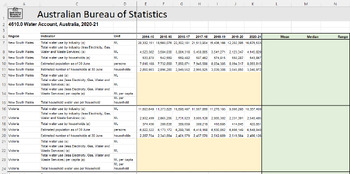
Excel Statistics Task - Australian Water Consumption
Dive deep into the waters of data analysis with this engaging Microsoft Excel activity focused on Australian water consumption! Sourced from the Australian Bureau of Statistics, students will navigate through real-world datasets from 2014-15 to 2020-21, equipping them with skills that extend beyond the classroom. What's Included:Interactive Spreadsheet: An authentic spreadsheet titled "Water Account, Australia (2020-21)" filled with key indicators for water consumption and use.Guided Instruction
Grades:
7th - 12th
Types:
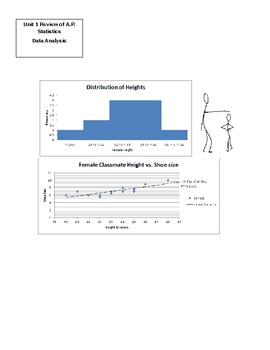
Data Analysis Review Project for A.P. Statistics
This project reviews the data analysis unit for A.P. Statistics. Data collected from students will be their height and shoe size. The file includes the project description page to be handed to students along with a rubric. Included are the step-by-step Excel directions on analyzing the data and creating histograms. The project also includes an investigation on the correlation between height and shoe size. This portion of the project may work for Algebra 2 teachers wishing to review the least squ
Subjects:
Grades:
10th - 12th, Higher Education
Types:
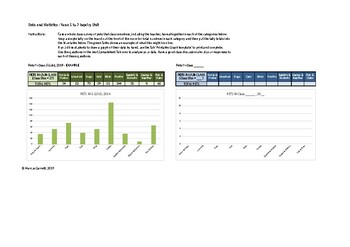
Middle School Data Inquiry Unit
This selection of Inquiry activities in Excel provides teachers and students from Grades 5 to 7 with some practical 'Data and Statistics' tasks, to put into practice some of the concepts they learn about in this strand of Mathematics.The resource includes a range of tabs, providing:Empty tables and an automated graphing tool for the collection of authentic data regarding pets in a class groupA printable blank graph for hand graphing this data, should teachers require students to do so;A series o
Subjects:
Grades:
5th - 7th
Types:
Showing 1-24 of 29 results


