15 results
Graphing lessons for Microsoft Excel
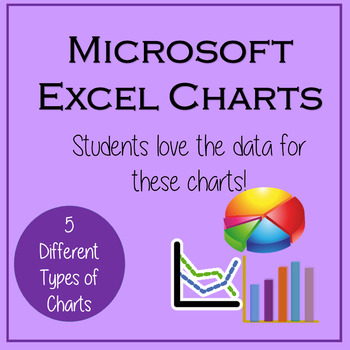
Excel Lessons - Creating Charts
No Prep! These lessons are great as a first Excel Chart lesson or for students already a little familiar with creating charts. Students love the data for these charts because the data is centered around things they love – their cell phones! In Lesson 1, students will create 5 different charts from step-by-step directions which include Chart Titles, Chart Styles, Axis Titles, Data Labels, and Moving Chart to its own Sheet.In Lesson 2, students will create 5 charts from provided data as well as ch
Grades:
5th - 12th
Types:
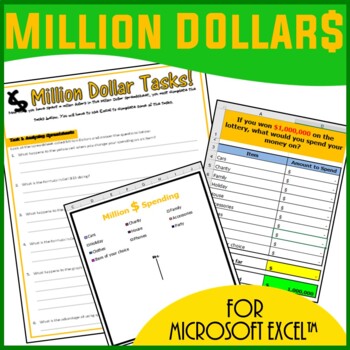
Excel Spreadsheets Million Dollars Activity
This resource allows students to understand the following: How graphs change when spreadsheet data is alteredUse of SUM() functionsHow graphs are madeComponents of a graphAdvantages of spreadsheets over pen and paper methodsStudents use this resource to understand how altering data in spreadsheets allow graphs to change. They understand such concepts by trying to spend a Million Dollars in a minute. Students are then expected to complete the associated worksheet which accompanies the spreadsheet
Grades:
5th - 12th, Adult Education
Types:
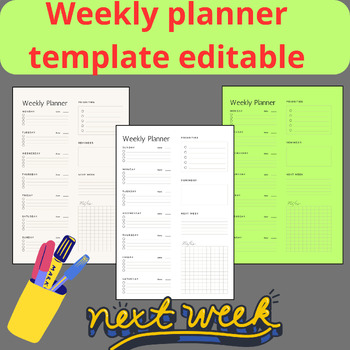
Weekly planner template editable _ Editable daily weekly teacher planner digital
The weekly planner template is a useful tool for organizing and managing tasks, appointments, and activities throughout the week. This editable weekly planner template provides the flexibility to customize and adapt the design to suit your specific needs and preferences. Here is a description of a typical editable weekly planner template: 1. Layout: The template usually features a clean and organized layout with the days of the week arranged horizontally from Monday to Sunday. 2. Editable Fi
Subjects:
Grades:
Not Grade Specific
Types:
5 Projects to Integrate Technology in Math Lessons
What's included in the Math bundle: * Five step-by-step lessons, including reproducibles, grading rubrics, sample projects, extensions for advanced students and troubleshooting tips where applicable * A brief summary of each project, including suggested grade level and prior knowledge, time required, software required * Higher-order thinking skills addressed * Technology-specific skills taught (including ISTE)Projects include: Keeping a Timecard in Excel, Beginning Graphs with Excel,
Subjects:
Grades:
Not Grade Specific
Types:
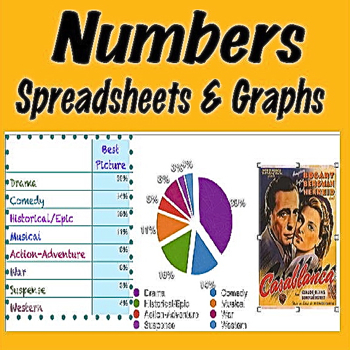
Numbers Spreadsheets and Graphs
The skills needed to create spreadsheets and graphs will stand students in good stead from junior high school through college and into their professional lives as adults. Start in 7th grade to teach your students how to create these data and math skills with Apple’s program called Numbers. And although, the assignments provided in this unit are written to take advantage of the tools available in Numbers, if you’re a Microsoft user, the ideas can be easily converted to Excel spreadsheets and g
Subjects:
Grades:
7th - 9th
Types:
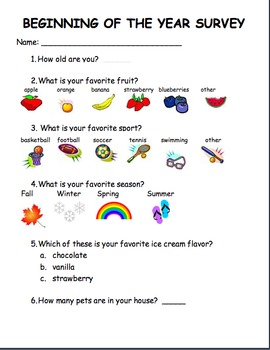
Beginning of the Year Graphing
This is a fun beginning of the year activity. It gets the kids to work together in small groups and introduces the concept of graphing. Included is a survey sheet for students to fill out themselves, then the group records results together. Once all of the student results are in, the class can be divided into groups to color in the bar graphs using the data.
*Survey includes first grade ages, but could be modified for K or 2nd.
Subjects:
Grades:
K - 2nd
Types:
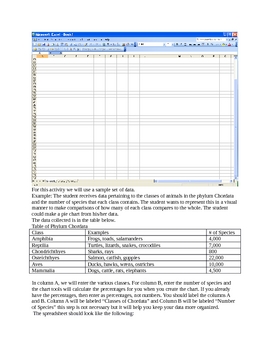
Creating Pie Charts with a Spreadsheet Program
This is a lesson/tutorial on how to create great looking pie charts using spreadsheet tools like MS Excel or Google Docs. Included is an independent practice section for students to complete and many visuals.
Grades:
7th - 12th
Types:
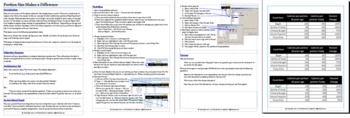
Portion Size make a Difference -Spreadsheet(Excel) Lesson
Most of us are aware of the obesity epidemic that is plaguing our youth. There are a whole host of reasons why this is. One reason is that our concept of what constitutes a portion of food has drastically changed. Food portions have gotten much larger, more than double in many cases, in the past 20 year. In this lesson we use actual data collected from the National Heart, Lung and Blood Institute website to explore these changes in a spreadsheet (I use MS Excel) . Depending on the age and abilit
Subjects:
Grades:
5th - 12th
Types:
Creating a Scatter Plot using Spreadsheets
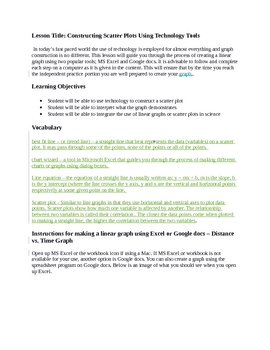
This is a lesson/tutorial created for students to follow in order to help them gain the skills to create their own charts and graphs using a spreadsheet program. There is also an independent practice portion added to the end of the lesson and suggestions for the teacher.
Grades:
8th - 12th
Types:
Basics of Excel: Working With Charts and Data on Macs
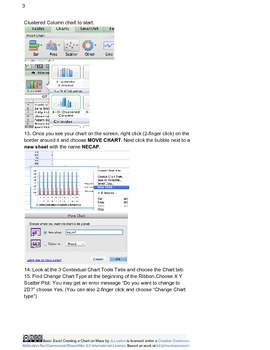
Step by Step lesson on creating charts, sorting and manipulating data in Excel Mac Version. This is a lesson for teachers trying to use assessment or other data to report or as a student lesson on using Excel.
Grades:
4th - 12th, Higher Education, Adult Education, Staff
Types:
Easter Egg Graphing - Common Core First Grade
Students choose their favorite color Easter Egg (and decorate it too!). Students will collect data using tally marks, then they will organize the data into a representational bar graph. There are simple questions to answer to assess how they analyze the data.
Included: Lesson outline, egg pattern, tally boxes, bar graph, questions.
CCSS.Math.Content.1.MD.C.4 Organize, represent, and interpret data with up to three categories; ask and answer questions about the total number of data points, how
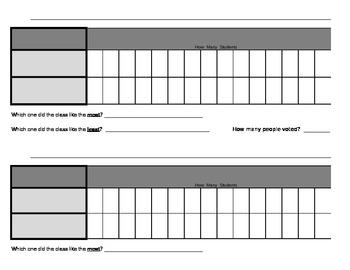
Bar Graph for Survey Questions
Survey the class giving them 2 options. (ie: Are you right-handed or left-handed? Do you like Winter or Summer better? Do you like white chocolate or milk chocolate better?). Use tally marks to record each student's response. Transfer that data to this ready-made graph. Students write a title and labels, analyze the class data to create a bar graph, then answer simple questions. The graph is generic enough to use with any 2 choice survey question, but detailed enough to be effective. (There are
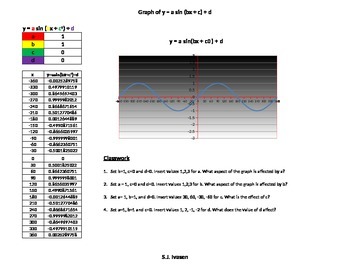
Graph of a sin (bx+c) + d
The effects of a,b,c and d in y=a.sin(bx+c) + d are illustrated by changing their values and viewing the graph
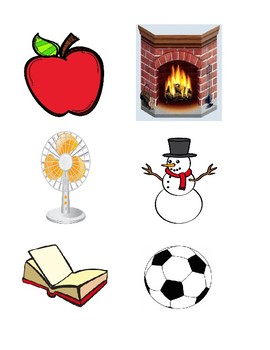
Fire Safety - Hot or Not?
This is meant to be used as pictures for a circle time graph labeled 'Hot or Not'.
Showing 1-15 of 15 results


