TPT
Total:
$0.00

Excel Graphing Summer Fun with Digital Student Directions

Rated 5 out of 5, based on 1 reviews
5.0 (1 rating)
;
Caryn Dingman
120 Followers
Grade Levels
3rd - 6th, Homeschool
Resource Type
Standards
Formats Included
  • PDF
  • Google Apps™
  • Excel Spreadsheets
Pages
24 pages
$4.00
$4.00
Share this resource
Report this resource to TPT
Caryn Dingman
120 Followers
Includes Google Apps™
The Teacher-Author indicated this resource includes assets from Google Workspace (e.g. docs, slides, etc.).

Description

The last marking period of the school year can be a challenging time to keep students engaged…

they’re thinking about summer…

you’re thinking about summer…

#embraceit

This Summer Fun Excel project can be a perfect way to:

* integrate technology

* extend and enrich a math topic of study

* introduce students to creating sheets and charts using Excel

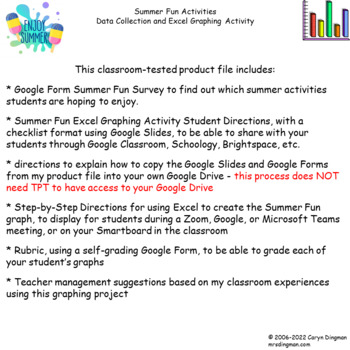
Project file includes:

* teacher notes/ classroom management suggestions

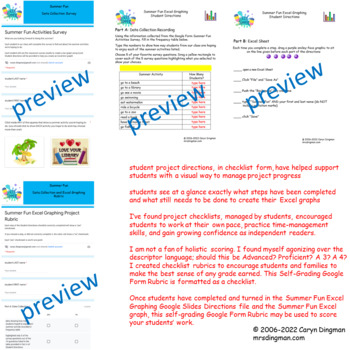
* digital survey, using a Google Form, to collect summer activities data

* digital student directions in checklist form, using Google Slides

* rubric, using self-grading Google Form, to grade finished graphs

* I’ve used this as a back to school project as well as an end of year activity

* my students were able to complete this project with two or three 15-minute small group center sessions

* My 5th graders completed this project as a performance task- small groups of students working independently on Chromebooks or desktop computers in rotating 15-minute turns during my 90-minute Math block, working at their own pace through the project checklist directions

* I’ve used this project with younger students, or students needing adaptations, in small groups as well- reading the project checklist directions aloud to those small groups for a 10 or 15-minute rotating center turn

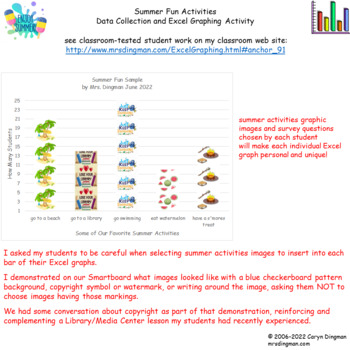
Classroom-tested student samples may be viewed on my classroom web site:

http://www.mrsdingman.com/ExcelGraphing.html#anchor_91

Total Pages
24 pages
Answer Key
Does not apply
Teaching Duration
N/A
Report this resource to TPT
Reported resources will be reviewed by our team. Report this resource to let us know if this resource violates TPT’s content guidelines.

Standards

to see state-specific standards (only available in the US).
Draw a scaled picture graph and a scaled bar graph to represent a data set with several categories. Solve one- and two-step “how many more” and “how many less” problems using information presented in scaled bar graphs. For example, draw a bar graph in which each square in the bar graph might represent 5 pets.
Make a line plot to display a data set of measurements in fractions of a unit (1/2, 1/4, 1/8). Solve problems involving addition and subtraction of fractions by using information presented in line plots. For example, from a line plot find and interpret the difference in length between the longest and shortest specimens in an insect collection.
Make a line plot to display a data set of measurements in fractions of a unit (1/2, 1/4, 1/8). Use operations on fractions for this grade to solve problems involving information presented in line plots. For example, given different measurements of liquid in identical beakers, find the amount of liquid each beaker would contain if the total amount in all the beakers were redistributed equally.
Recognize a statistical question as one that anticipates variability in the data related to the question and accounts for it in the answers. For example, “How old am I?” is not a statistical question, but “How old are the students in my school?” is a statistical question because one anticipates variability in students’ ages.
Understand that a set of data collected to answer a statistical question has a distribution which can be described by its center, spread, and overall shape.

Reviews

Questions & Answers

120 Followers