31 results
Graphing projects for Microsoft PowerPoint
3rd Grade Data
3rd Grade Data: This third grade resource on data includes a PowerPoint on four types of data, a small group project using data, a foldable graphic organizer on data, and a quiz on collecting, organizing, displaying and interpreting data for Third Grade TEKS 3.8A and 3.8B: This bundle of resources is closely aligned to the Texas Math Standards TEKS 3.8A and 3.8B. The 30 slide PowerPoint presentation introduces word problems related to everyday life. It includes problems with bar graphs, pict
Subjects:
Grades:
3rd
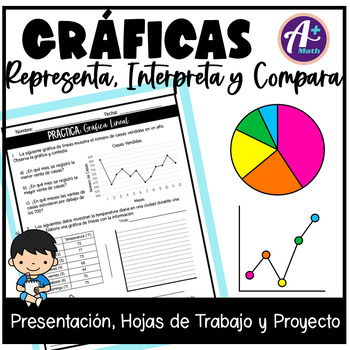
Gráficas - Estadística
Gráficas - Estadística - Analizar DatosEste recurso trabaja los siguientes temas:Gráficas: Representa, Interpreta y Compara•Recopilar y Organizar Datos •Tabla de Frecuencias•Gráfica de Barras•Gráfica Circular•Gráfica Pictórica•Gráfica Lineal•Tabla de Tallo y Hojas•Diagrama de PuntosEl recurso incluye:•Presentación en PowerPoint y PDF - 55 diapositivas con explicaciones y ejemplos•8 hojas de trabajo - Incluye la clave de respuestas•3 hojas de trabajo - Proyecto - Encuesta y analiza los res
Subjects:
Grades:
4th - 6th
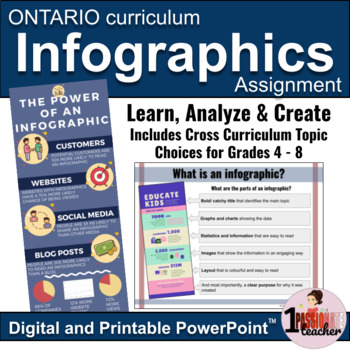
Infographics | New Ontario Math Curriculum 2020 | Editable PowerPoint
Teach your students about the power of using infographics in data management to tell a story about any topic. This lesson, practice and creation activity is as flexible as you need it to be right now. Includes rubrics and multiple curriculum topic suggestions for grades 4, 5, 6, 7 and 8 from Ontario curriculum expectations, including the New Ontario Math Curriculum 2020 and can be used for virtual or in-person learning.And like with all of my products, this resource is completely editable! Perfe
Subjects:
Grades:
4th - 8th
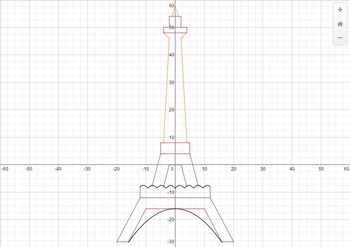
Linear Equations Project - Graphing the Eiffel Tower
Discover linear equations the fun way. This is a 5 day project that is ready to use. Implementing it in your class will be as easy as pi.
Students will need access to a computer or iPad. They will use a powerful online graphing calculator to create a drawing of the Eiffel tower via www.desmos.com.
Students will learn about:
Writing linear equations in point-slope form
Writing linear equations in slope-intercept form
Writing equations of parallel lines
Graphing horizontal and vertical lines
Subjects:
Grades:
8th - 12th
CCSS:
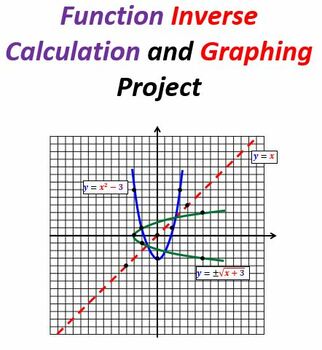
Function Inverse Calculation and Graphing Project
PLEASE NOTE: THE PREVIEW VERSION OF THIS PRODUCT IS THE ACTUAL "STUDENT VERSION" AND DOES NOT INCLUDE ANY OF THE ANSWERS TO THE PROBLEMS. THE MAIN PRODUCT VERSION INCLUDES DETAILED ANSWERS TO ALL OF THE PROBLEMS FOR THE PROJECT. This project activity involves the calculation, graphing and coloring of inverse functions including linear, quadratic, radical (square root and cube root) and cubic polynomial types. I have my Algebra 2, Math 3 and Precalculus students complete this project toward th
Subjects:
Grades:
10th - 12th
CCSS:
BUNDLE: Functions and Relations Power Point with Corresponding Lab/ NO PREP
Students find the following lesson and corresponding activity to be an exhilarating mathematical experience!* Why?* They find it exhilarating, because after going through the lesson and the accompanying activity, they readily understand a simple but confusing concept. * The power point includes a 39 page power point over Functions and Relations along with a 19 page Math Lab written by yours truly. * The Math Lab provides "hands-on" experience to students where they use a pair of
Subjects:
Grades:
6th - 9th, Higher Education, Adult Education
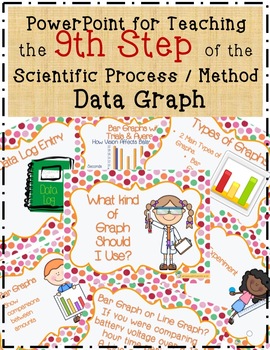
9 Science Fair Data Graph PowerPoint Lesson with Experiment, Directions & Rubric
Step 9 - Data Graph - Use this PowerPoint to teach the 9th step of the Scientific Process. This lesson includes: Essential Question (Question of the Day), Vocabulary, Examples, Directions, Rubric, and an Experiment to practice making an appropriately labeled data graph. After the lesson and hands-on experiment, students will be guided in setting up their data graph for their own science fair project. When students understand each step of the scientific process from hands-on experience, they can
Subjects:
Grades:
3rd - 6th
Also included in: Complete Science Fair *Growing Bundle*
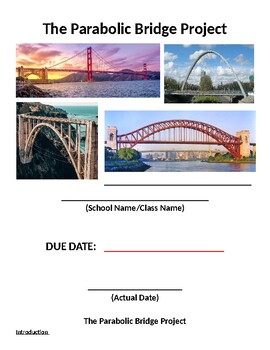
Parabolic Bridge Project
The purpose of this project is to give your students a deeper understanding of the applications and use of quadratic equations or parabolas in the real world. During this project the students will analyze, design and construct scale model, parabolic-shaped bridges. The students will calculate the quadratic equations associated with each of bridges they choose to design. I always cut out the wood sections for their bridge designs and have them paint and assemble the sections. I complete this
Subjects:
Grades:
9th - 12th
CCSS:
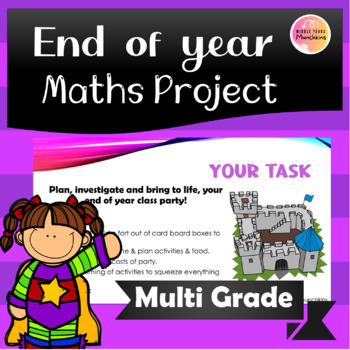
End of Year Math Party Planner
End of year project for after assessment. Help keep your class switched on by planning their very own class party for end of year celebrations. This PPT has the main resources on how to introduce the topics. The following are encouraged to include along side this resource. Mini lessons on how to conduct surveys, how to graph results and read tables of information. Mini lessons on how to read time and read timetables. Convert minutes to seconds etc. Mini lessons on money and how to add/ subtract.
Subjects:
Grades:
3rd - 6th
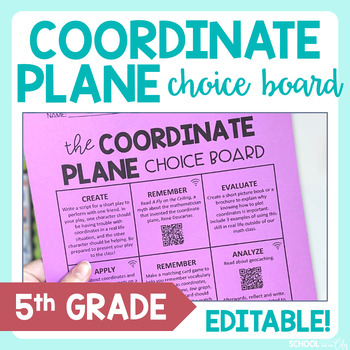
Coordinate Plane 5th Grade Math Choice Board - Editable Extension Activities
Are you looking for an engaging resource to challenge your high-achieving students or to make time meaningful for early finishers? Are you hoping to cater to varying learning styles and free up time for yourself to enrich or remediate? Look no further!WHAT'S INSIDE?This is an editable choice board focused on 5th grade graphing: understanding the coordinate plane and plotting ordered pairs. Activities are based on 5th grade Common Core math standards (5.G.A.1 and 5.G.A.2) but you can edit to fit
Grades:
5th
Types:

Data Handling: Traffic Nightmare Tally and Bar Charts Project
A fantastic and very comprehensive resource including a Traffic Nightmare project book, lesson plan, student objective sheets, PowerPoint extended data collection exercise, PowerPoint Tally Chart Bingo, student bingo sheet and a PowerPoint introduction to using tally charts.
This project focuses on a scenario where the opening of a local supermarket has resulted in a great increase in heavy traffic through a residential area. The students tally the vehicles they see on screen to 'prove' the incr
Subjects:
Grades:
Not Grade Specific
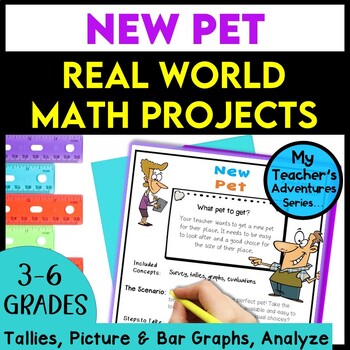
Real World Math Projects Tallies and Graphing | Inquiry Based Math New Pet
This real world math project focuses on math in practice and covers tallies, surveys and graphing concepts. Students help their teacher find a new pet!Are you looking for the hook to get your students excited in math? Students love thinking about what their teacher's lives are like outside of school. This is how the "My Teacher's Adventures in series" was started. Let your students work on mathematical projects of fun adventures/ stories about possible scenarios that you as a teacher may have!Th
Subjects:
Grades:
3rd - 6th
Types:

Distance Learning: Physical Education Fitness Journey - A 4 Week Challenge
This product is a goal setting culminating task for a fitness unit, where students set their own goals and reflect on their progress as they go within a 4 week period. Instructions and expectations are laid out on a Google Slide Deck - making it perfect for distance and virtual teaching. This slide deck also acts as a graphic organizer in which students can keep track of their goals and record their reflections. This product does NOT come with a teacher guide or rubric.
Subjects:
Grades:
4th - 12th
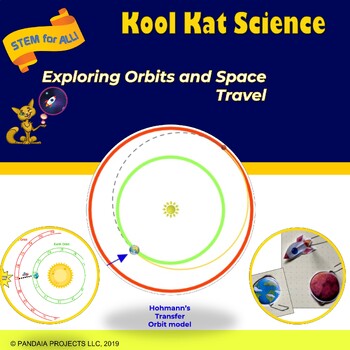
To Mars and Back
Humans have dreamed of visiting Mars since the 1880s, but getting there isn’t easy. Using a game board modeled after the orbits of Mars and Earth, student teams will plot a course to Mars and back. As they plan their Mars mission, students will use the same navigation method that NASA uses for interplanetary travel - the Hohmann Transfer Orbit. You can use this STEM activity, and the included Rover's slideshow to introduce a Solar System unit or a Mars rover design project. In addition to plann
Subjects:
Grades:
3rd - 5th
NGSS:
3-PS2-2
, 4-PS3-1
, 5-PS2-1
, 3-5-ETS1-2
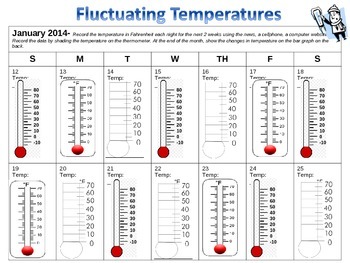
Fluctuating Temperatures Calendar
This editable calendar can easily be used throughout the year to have students practice more with temperature, recording data, and making conclusions about data.
For 2 weeks, students record the daily temperature and shade it on various thermometers (the thermometers have different intervals, to give students more practice with reading different thermometers). At the end of the month, they take all of their data and record it in a bar graph.
Subjects:
Grades:
2nd - 5th
Types:
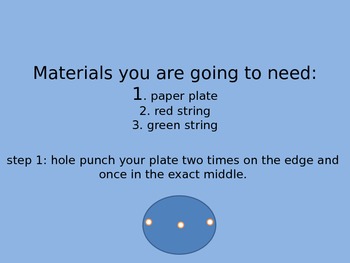
Area and Circumference paper plate activity
This is an a project that is worked on in class as notes. You will need a paper plate, 2 colors of string, hole punch, and markers. It covers what diameter, radius, area, circumference, and formulas for each. The students follow the steps through the powerpoint to create their plate.
Grades:
7th - 8th
Types:
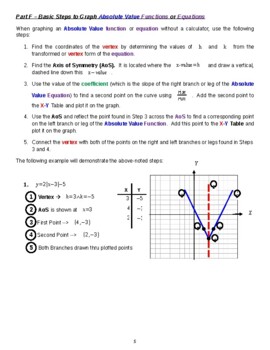
Absolute Value Functions Calculation and Graphing Project
PLEASE NOTE: THE PREVIEW VERSION OF THIS PRODUCT IS THE ACTUAL "STUDENT VERSION" AND DOES NOT INCLUDE ANY OF THE ANSWERS TO THE PROBLEMS. THE "TEACHER VERSION" INCLUDES DETAILED ANSWERS TO ALL OF THE PROBLEMS FOR THE PROJECT.This project involves the calculation, graphing and coloring of absolute value functions. I have my Algebra 2/Math 3/Precalculus students complete this project toward the end of the unit on absolute value functions.A total of ten (10) absolute value functions require solu
Subjects:
Grades:
9th - 11th
CCSS:
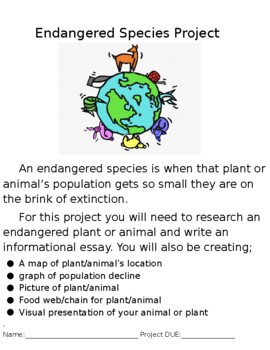
Endangered Species Project
This project encompasses writing about endangered animals. It conforms to NGSS standards as well as Common Core standards for ELA and Math (California). It contains a rubric, graphic organizer, and examples for students. This project can be edited to fit your classroom needs.

Made in the U.S.A.?
Here is a real-world Economics lesson for your students! After identifying where clothing items are made, students will practice map skills to locate the countries and create a tally chart. Then they will be asked to create a bar graph. A rubric is included to help you grade student's work. You can make this an independent project or small group.
Subjects:
Grades:
4th - 6th

Qunota Power Point Template
Qunota – PowerPoint TemplatePresentation Features150+ Total Slides, on 5 Premade colors30 Slides for each Template5 Color VariationHandcrafted Infographic in PowerpointSection Break SlidesGallery and Portfolio slideResizable and Editable GraphicPicture Placeholder, drag & dropBased on Master SlidesPixel-perfect illustrationsWhat’s included?5 PPTX Files5 PPTX Widescreen5 premade colorReadme FirstFont used (free font download link included)
Subjects:
Grades:
10th - 12th, Higher Education, Staff

Cold War Sidewalk Chalk Project
I love this project, and most students do too. The math teacher on my team also loves it, because we use x/y values on the coordinate plane to make our sidewalk chalk creations.
After your instruction on the events of the Cold War, this project asks students to choose one major event from the period. Next they select a map or image of their choice and copy/paste it on the provided x/y axis graph. Students then collect data points for their picture. We then use these data points to 'connect the
Subjects:
Grades:
7th - 9th
Types:

Fantasy Watercolor Digital Paper Set
These beautiful papers are perfect for custom scrapbook layouts, scrapbook albums, photo books, invitation cards, candy wrappers, recipe cards, greeting cards, jar labels, note cards, junk journals, gift bags, party sets, calendars, collages for clients, sticker Sheets, planners, social media posting, blogs and alot more!You will receive:– 5 digital papers– JPG format– High resolution (300dpi)
Subjects:
Grades:
Staff
Pie Chart
HOW TO CREATE A PIE CHART IN MICROSOFT 2013
LET THE CREATING BEGIN!!
Make the change for your students. Switch to digital graphs. These directions are clear and easy to follow. Your kids will be thrilled with their digital creations.
Description:
You receive both the PowerPoint consisting of 13 slides and the same presentation in PDF format. Use the clear, easy-to-understand screen shots, to walk your students through setting up their own pie chart. ALL your kids will wonder why they haven’t
Grades:
3rd - 6th
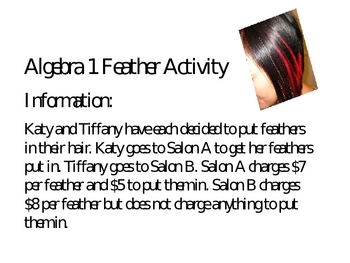
Algebra 1 Writing Prompt
This is a real world application problem that involves solving a system of equations. Students write equations of lines and graph those lines. There is also a writing component to this activity.
Subjects:
Grades:
8th - 10th
Types:
Showing 1-24 of 31 results


