3 results
Arithmetic projects for Microsoft Excel

Reading Between the Lines - A Graphing Activity
This graphing activity is a fun way to combine Reading and Math. Using excerpts from school novels, students can create frequency tables and a variety of graphs either by hand or on the computer. This 1-2 class activity can be adapted for any grade level and can be done in small groups or individually. It can also be worked on over a period of time. Give it a try!
Subjects:
Grades:
6th - 7th

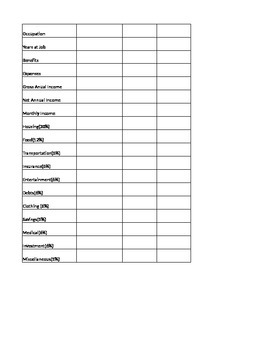
Occupational Spreadsheet
This is a Spreadsheet for showing students where their money goes after taxes and bills. The student picks a reasonable career and inputs the gross salary income and can see where their money goes toward. The lesson is great to show percents and talk about taxes. Students really liked the exercise and had fun seeing if their job would provide what they thought it would.
Subjects:
Grades:
8th
Types:

Electoral College and Election
This project is a cross-curricular project for math and social studies that will take about a week to complete.
Through the study of the Electoral College, you’ve learned that the actual final decision concerning who wins the presidential election entails more than just winning a popular vote. Historically, individual state population is the driving force for the number of electoral votes per state. For this project, one must consider:
• How has the number of electoral votes changed from st
Subjects:
Grades:
6th - 8th
Showing 1-3 of 3 results


