148 results
Graphing projects for Google Apps
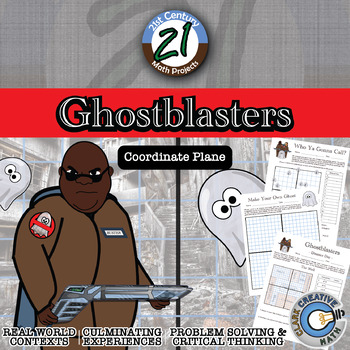
Ghostblasters -- Ordered Pair & Coordinate Plane - 21st Century Math Project
There’s something strange in your neighborhood! Ghosts have managed to escape the capture chamber and have wreaked havoc all over the region. On the case in this 21st Century Math Project is an upstart ghost catching team, the Ghostblasters. Given the ordered pairs on the Ghostblasters radar, find which buildings are infested with ghosts.Blend ordered pair and coordinate plane practice with fun for all!In this 20 page document you will be given a mapping to the Content Standards, an outline for
Grades:
5th - 12th
Types:
Earth Day Math Project for Graphing and Data Interpretation
This resource is included in PDF format for printing and in Google Slides™️ format for digital learning. This makes it useable with Google Classroom™️.Are you looking for a way to reinforce graphing and data interpretation concepts in an engaging way that helps your students make connections? “Our Earth” is a real-life math project where students will complete eleven different graphing and data-related tasks. These activities can be used as a package, or in isolation. They work great as a math c
Subjects:
Grades:
2nd - 3rd
Also included in: Math Projects & Escape Rooms for Grades 2-3 | Bundle of Ten
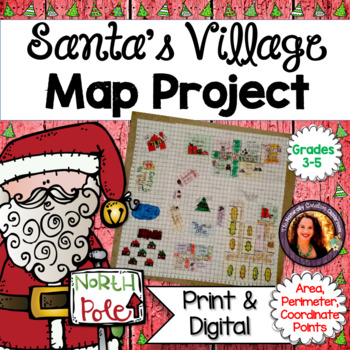
Christmas Math Activity Bundle | Area, Perimeter & Graph Map Project
Design the North Pole! Keep students engaged and learning during this busy time of year! This Christmas Math Activity project is a hands-on way to reinforce area, perimeter, factor pairs, map skills and finding and identifying coordinate points on a graph. For each item student are asked to record the arrays used, multiplication facts that helped them, the total area and the perimeter of each item. Some items are a simple rectangle, while other aspects, such as the reindeer barn have rooms wi
Grades:
3rd - 5th
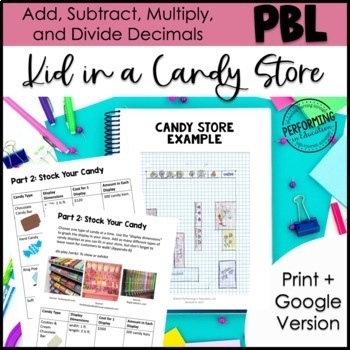
Add, Subtract, Multiply Decimals Project Based Learning | Valentine's Day
Looking for an exciting and engaging way to teach your 5th graders about adding, subtracting, and multiplying decimals? Look no further than our "Adding, Subtracting, Multiplying Decimals Project Based Learning for 5th" math project! This is a great PBL for Valentine's Day or any other day of the year with the engaging candy shop theme.This week-long math project is designed to help students develop a deep understanding of these key mathematical concepts through hands-on activities that challeng
Subjects:
Grades:
4th - 6th
Also included in: 5th Project Based Learning Math Starter Kit Bundle
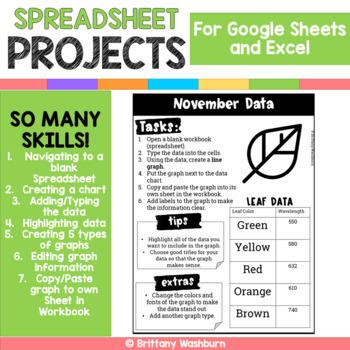
Google Sheets and Excel Spreadsheet Projects {12 Months}
12 projects with monthly themed data for students to practice creating spreadsheets in Google Sheets or Excel. There are 2 optional rubrics included too if you want to make this an assessment tool.SO MANY SKILLS!1. Navigating to a blank Spreadsheet2. Creating a chart3. Adding/Typing the data4. Highlighting data5. Creating 5 types of graphs6.Editing graph information7.Copy/Paste graph to own Sheet in Workbook1 for each month of the year (I stayed away from religious holidays)Works for any spreads
Grades:
2nd - 5th
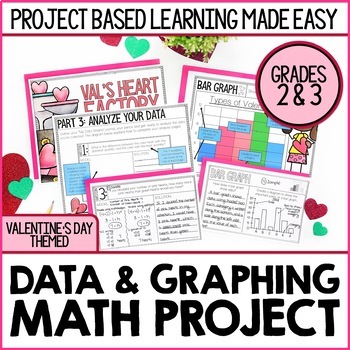
Valentine's Day Math Project | Conversation Hearts Graphing Lesson & Activity
This Valentine's Day-themed math project introduces your students to four methods for displaying data: Frequency TablesBar GraphsPictographsLine Plots Your students will record observations about each method for displaying data and compare/contrast methods for collecting data. Students will then use this knowledge to solve a problem for Val’s Heart Factory. Love this project idea, but planning to teach graphing at a different time of year? Sal's Sweet Factory will be a perfect fit for your class
Subjects:
Grades:
2nd - 3rd
Types:
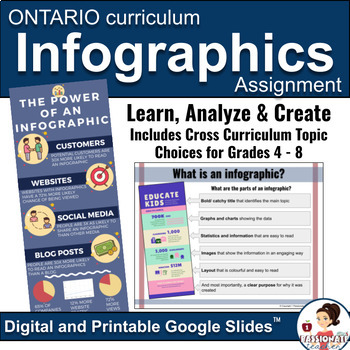
Infographics | New Ontario Math Curriculum 2020 | Digital Lesson and Assignment
Teach your students about the power of using infographics in data management to tell a story about any topic. This lesson, practice and creation activity is as flexible as you need it to be right now. Includes rubrics and multiple curriculum topic suggestions for grades 4, 5, 6, 7 and 8 from Ontario curriculum expectations, including the New Ontario Math Curriculum 2020 and can be used for virtual or in-person learning. And like with all of my products, this resource is completely editable! Perf
Subjects:
Grades:
4th - 8th
Types:
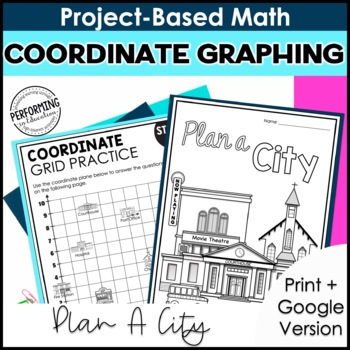
Math Project-Based Learning: Coordinate Graphing | 5th Grade Math
This 5-day project-based math resource applies math concepts in a real-world scenario to teach students about coordinate graphing. In this 5-day unit, students will use coordinate graphing skills, such as graphing ordered pairs, to plan a city. This math project is engaging and authentic. Plus, it's available as both a digital and print resource.This project-based math resource covers concepts of coordinate graphing and is aligned with the following 5th Grade Math Common Core State Standards:CCS
Subjects:
Grades:
5th
Types:
Also included in: The Project-Based Math Library | 5th Grade Math Project-Based Learning
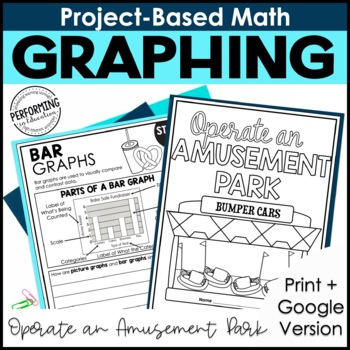
Math Project-Based Learning: Draw Picture Graphs & Bar Graphs | Data | 3rd Grade
This 5-day project-based math resource applies math concepts in a real-world scenario to teach students about drawing scaled picture graphs and scaled bar graphs. In this 5-day unit, students will apply graphing concepts to create scaled picture and bar graphs and answer questions about the data in the graphs. This graphing math project is engaging and authentic. Plus, it's available as both a digital and print resource.This project-based math resource covers concepts of rounding and is aligned
Subjects:
Grades:
3rd
Types:
CCSS:
Also included in: The Project-Based Math Library | 3rd Grade Math Project-Based Learning
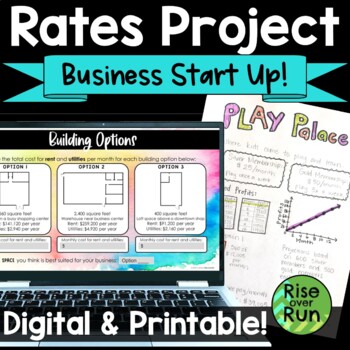
Rates & Proportional Relationships Real World Project
Students work with real world rate of change and proportional relations as entrepreneurs creating a business startup! They will love getting creative, and you will love that everything is ready to go to get them thinking about math. This project is included in printable PDF version, Google Slides, and PowerPoint.In this project, students get creative as they decide on a type of business, membership fees, and a building location. Then they must calculate their costs and profits based on those dec
Measurement Math Project for Distance, Time, Money, Graphing
This resource is included in PDF format for printing and in Google Slides™️ format for digital learning. This makes it useable with Google Classroom™️.Are you looking for a way to reinforce measurement concepts in an engaging way that helps your students make connections? “The Road Trip” is a real-life math project where students will complete eleven different measurement-related tasks. Please note that both metric and imperial versions are included!Take a look at what you’ll find inside this ma
Subjects:
Grades:
4th - 5th
Also included in: Real Life Math Projects and Escape Rooms (4-5): Bundle of Ten
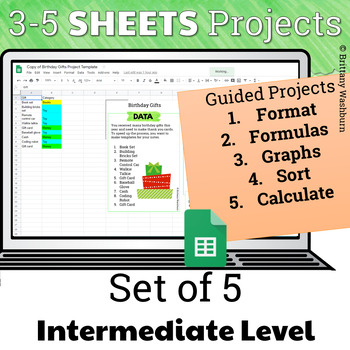
Google Sheets Projects for Grades 3-5
Guided Projects that Teach several skills in Google Sheets are the ideal way to build technology literacy for our youngest students. This set of 5 projects show students functions, formulas, formatting, graphing, calculations, and so much more so that by the time they get through the final project they could do it independently. Teacher Guide Includes:Standards AddressedLinks to the Google Sheets TemplatesHow to use the project templatesHow to use the printable PDF optionIncorporating the Spread
Grades:
3rd - 5th
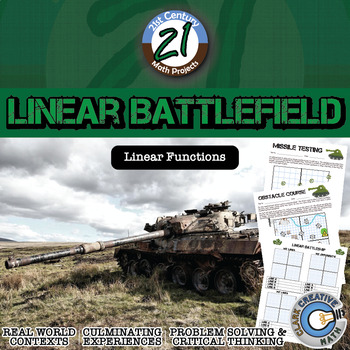
Linear Battlefield -- Graphing Linear Equations - 21st Century Math Project
This is my twist on a popular Algebra game, Linear Battleship. In this 21st Century Math Project, students will work on graphing and reading graphs of linear equations. I've found that students are usually better at graphing the lines than writing the equations of graphed lines. These fun few assignments help reinforce those skills (and even practiced old ordered pairs). The 2-3 day unit will culminate in a Linear Battleship competition which might just turn into a class tournament! In this 9 pa
Grades:
7th - 12th
Types:
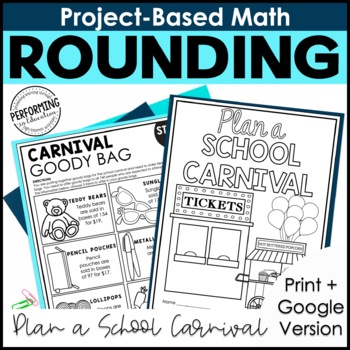
Math Project-Based Learning: Rounding to the Nearest 10 or 100 | Place Value 3rd
This 5-day project-based math resource applies math concepts in a real-world scenario to teach students about rounding to the nearest 10 and rounding to the nearest 100. In this 5-day unit, students will apply place value concepts to plan a school carnival. This rounding project is engaging and authentic. Plus, it's available as both a digital and print resource.This project-based math resource covers concepts of rounding and is aligned with the following 3rd Grade Math Common Core State Standar
Subjects:
Grades:
3rd
Types:
CCSS:
Also included in: The Project-Based Math Library | 3rd Grade Math Project-Based Learning
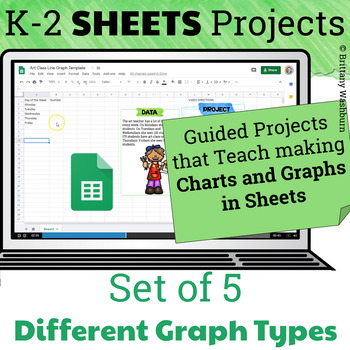
Google Sheets Projects for Grades K-2: 5 Types of Graphs
Guided Projects that Teach making Charts and Graphs in Google Sheets are the ideal way to build technology literacy for our youngest students. This set of 5 projects show students 5 different graph types so that by the time they get through the final project they could do it independently. Graph Types Included:ColumnBarPieLineScatterEach one requires students to create a chart of the data and then turn it into a graph.Teacher Guide Includes:Standards AddressedLinks to the Google Sheets Templates
Grades:
K - 2nd
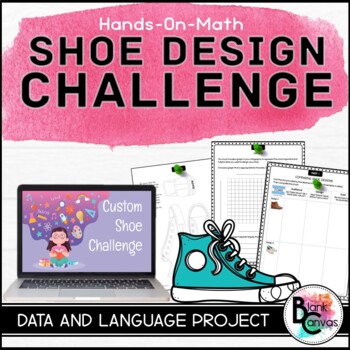
Shoe Design Challenge - A Data Management Project
Engage your students in data management with this fun and engaging cross-curricular shoe design challenge. This project based learning experience will have students collect data and analyze it to help design a shoe for a target audience. Once students have created their design, they will create an infographic about their shoe and persuade their audience on selecting the shoe. This organized 5-step process will be sure to encourage creativity. This project is versatile so you can adapt it to vari
Subjects:
Grades:
3rd - 8th
Types:
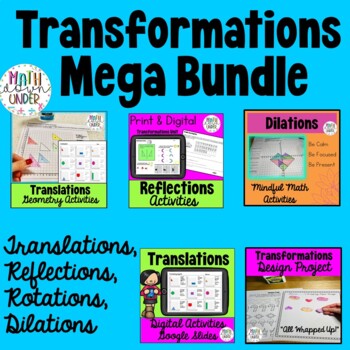
Geometry Transformations MEGA Bundle - PDF & Digital
Grab a bargain by bundling these nine great Geometry products that practices Transformations (Translations, Reflections, Rotation, Dilations)Included:Translation Activities - Cut n Paste Digital Translation ActivitiesReflections Investigation + PracticeRotations Practice SheetTranslations + Reflections Activity "What's you point?" - PDF & DigitalEnd of topic design project "All Wrapped Up!"Mystery picture (pi symbol) Translation Activity - PDF & DigitalDilations Mindful Math Activities -
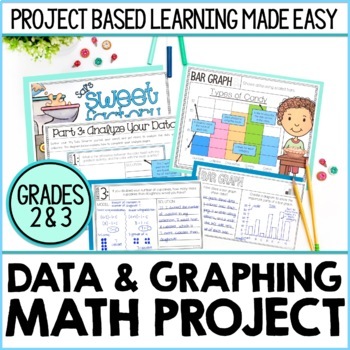
2nd & 3rd Grade Data and Graphing Math Project | Bar Graphs, Line Plots & More
This graphing math project introduces your students to four methods for displaying data: ★ Frequency Tables ★ Bar Graphs ★ Pictographs ★ Line Plots ★Your students will have the opportunity to record observations about each method for displaying data and compare/contrast methods for collecting data. They will then use this knowledge to solve a problem for Sal’s Sweet Factory. ***************************************************************************THE BIG PROBLEM YOUR STUDENTS WILL SOLVE:Sal's
Subjects:
Grades:
2nd - 3rd
Types:
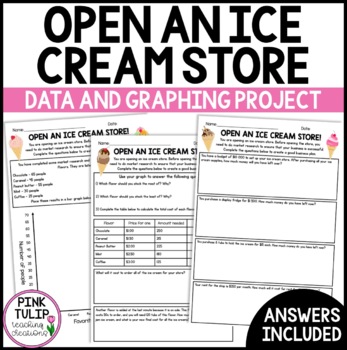
Open An Ice Cream Shop - Graphing and Data Math Activity
Open An Ice Cream Shop - Graphing and Data Math ActivityExtend understanding of graphing and data displays with this maths activity. This project is a great extension for early finishers, or the perfect assignment to implement at the end of a graphing and data module.This project encompasses a broad range of real-life mathematical skills, including budgeting and the four processes. It also requires students to research and price items for their store.This activity was designed to be used as a
Subjects:
Grades:
3rd - 6th
Types:
Also included in: Custom Order Resource Bundle #2
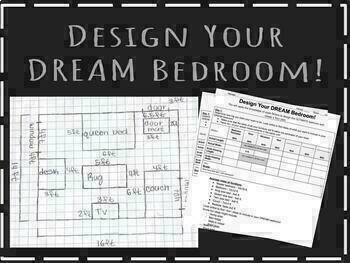
Fun Scale Drawing Project! (Minimal Prep)
Students will apply the knowledge of scale and scale factors to design their DREAM bedroom and create a floor plan! VERY MINIMAL PREP- all you have to do is print out the packets! Link for the project introduction Google slides included on the first page. Graph paper included on the third page.
Subjects:
Grades:
7th - 8th
Types:
CCSS:
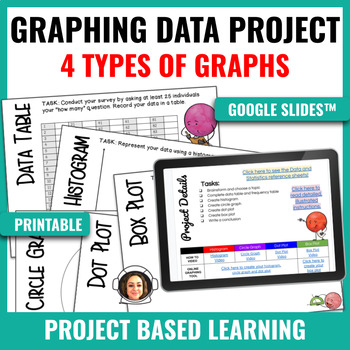
Graphing Data PBL - Histogram, Circle, Dot Plot, Box Plot
About this resource:This project takes students through the process of writing and conducting an original survey, then creating multiple representations of their data. Students will practice creating a histogram, circle graph, dot plot and box plot. Students will access "how to videos" as well as "online digital tools" that enable them to create the four graphs digitally. In the Google Slides™ version, support links are available for vocabulary references and data and statistics anchor charts. S
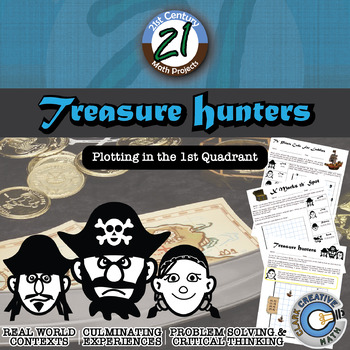
Treasure Hunters -- Plotting in Quadrant I -- - 21st Century Math Project
Ahoy! Thar's different ways to teach Plotting in the First Quadrant. Take a voyage with me!Students work develop their graphing points through three different pirate adventures. A pirate crew must navigate the treacherous seas and never venture out of the path (the serpent of unusual size might think you are grub!)In this 21st Century Math Project, you will be given a mapping to the Content Standards, an outline for how to implement the project, and handout resources for students to use. ***THIS
Grades:
5th - 6th
Types:
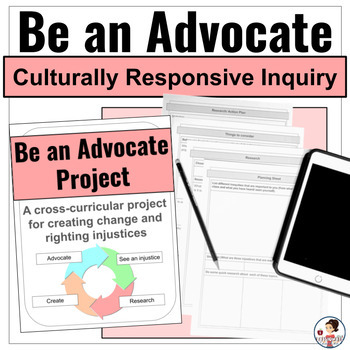
Cultural Awareness & Social Justice Project: Project Based Learning Inquiry
Culturally responsive teaching, social justice, and equity inquiry projects, student voice and choice, identity work... Are these ideas that you are trying to implement in your grades 5, 6, or 7 classrooms, but don't know where to begin? Don't worry passionate teacher, I have got you covered! I call it our advocate project (which is a passion project but WAY deeper) and it is exactly what you need to bring your student's identities and passions into the classroom while teaching them to speak up
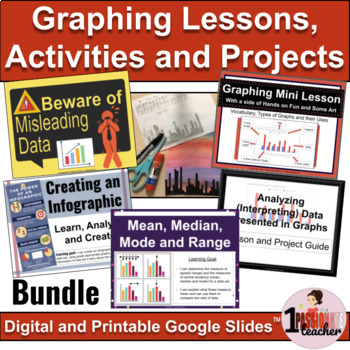
Data Management Ontario | Graphing | Data Literacy Bundle
Data collection, graphing vocabulary, types of graphs, inferring data, creating digital graphs, analyzing misleading graphs, infographics, measures of central tendency...this is what your students will learn and more, with this interactive graphing lessons and activities mega bundle. Save 20% with this multi-curricular bundle (math, writing and art); Everything you need for Graphing in your in-person, distance learning or hybrid Ontario math classroom (New Ontario Math Curriculum)! Check out my
Subjects:
Grades:
5th - 6th
Types:
Showing 1-24 of 148 results


