36 results
High school graphing laboratories $5-10

Beaker Pong: Experimental Design and Graphing Lab, NGSS aligned
Great 1st week or 1st month STEM activity! All parts are EDITABLE and includes a graphing grid! This is a great way to introduce the "science process" (better phrase for scientific method) at the start of a semester or anytime you want fun to occur in your classroom.*****Focus on the NGSS PRACTICES Dimension*****The National Research Council's (NRC) Framework describes a vision of what it means to be proficient in science; it rests on a view of science as both a body of knowledge and an evidenc
Subjects:
Grades:
7th - 12th
Types:
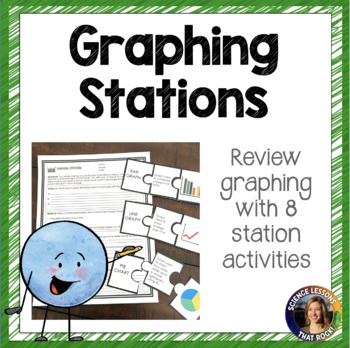
Graphing Station Activity
Included in this activity are 8 stations that are centered around graphing. The lesson is 17 pages and non-editable. See description below of each station and required materials.Station 1: At this station students determine which type of graph should be used based on 3 data sets. No additional materials are needed. Station 2: At this station students will create a best fit line and calculate slope. You will need to slide the page into a page protector, and provide a ruler, whiteboard marker, and
Subjects:
Grades:
8th - 10th
Types:
Scientific Method NGSS Crosscutting Concepts Activity & PowerPoint
Students will have a great time learning about science skills, experimental design, NGSS Cross Cutting Concepts, and NGSS Science and Engineering Processes with this resource! And it's Google Ready! It's packed with teacher notes to make your job easy!All you need are two tennis balls per group, one meter stick per group and something to keep the tennis balls cold like a cooler or freezer. The data really shows the difference between the bounce of a cold tennis ball and a room temperature ball.
Subjects:
Grades:
5th - 12th
Types:
MS-PS4-1 Mathematical Models of Waves Lab | Printable, Digital & Editable
About SNAPs Lab Stations ActivitiesSNAPs Lab Stations Activities require students to use science, math, literacy, problem-solving and engineering skills. They are designed to enhance students' understanding of scientific concepts and help students apply scientific ideas to the real world. Each station activity promotes skills so to develop students into proficient and competent scientific thinkers.SNAPs lab activities have five components:• Science Skills Station to develop science skill profici
Subjects:
Grades:
5th - 9th
Types:
NGSS:
MS-PS4-1
Also included in: Physical Science Lab Stations Bundle | Printable, Digital & Editable
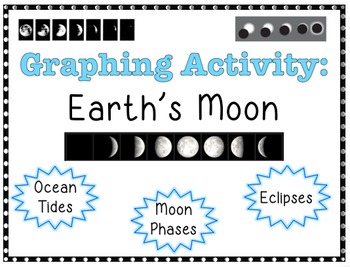
GRAPHING ACTIVITY Earth's Moon
This is a great way to incorporate graphing into a unit about Earth's Moon. Students will construct a total of 6 graphs (2 line graphs and 4 bar graphs) using data provided. Each part has questions to help students analyze the graph(s), apply information, and draw conclusions.
Part 1: Phases of the Moon
- Students will construct a line graph the percent of the illuminated part of the Moon seen from Earth each day for 1 month.
Part 2: Ocean Tides
- Students will construct a line graph for the
Subjects:
Grades:
8th - 12th
Types:
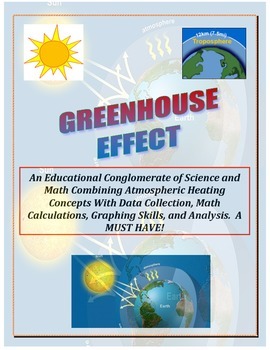
Weather LAB: Greenhouse Effect (A Must have for Combining Science and Math!)
PROCEEDS BENEFIT "REACH INC."-EMPOWERING ADULTS WITH DISABILITIES
http://www.reachinc.org
-Southern Science Specialists - Chapel Hill, North Carolina-
A MUST HAVE!
The Greenhouse Effect – one of the MOST MISUNDERSTOOD concepts in Earth Science. This LAB is a MUST HAVE! See PREVIEW!
A great blend of math (calculations and graphing), meteorology, physical science, and the scientific method.
No Materials? NO Problem! Students can complete this lab with the recommended materials or without u
Subjects:
Grades:
5th - 10th, Higher Education
Types:
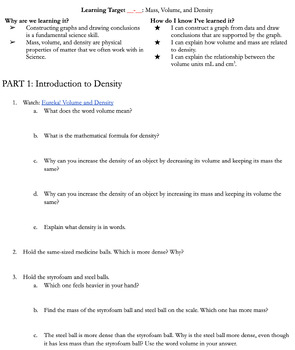
Mass, Volume, and Density Graphing Activities (Editable Doc)
There are so many ways to teach density it can be overwhelming to choose what to do. This is the best way I have found to teach it in my 10+ years of teaching Science. This lesson helps students learn so many things at the same time! It gives students:An introduction to the physical properties mass, volume, and densityAn introduction to water displacement to measure volumeAn opportunity to practice making measurementsAn opportunity to practice graphing data they collectAn opportunity to practice
Subjects:
Grades:
8th - 12th
Types:
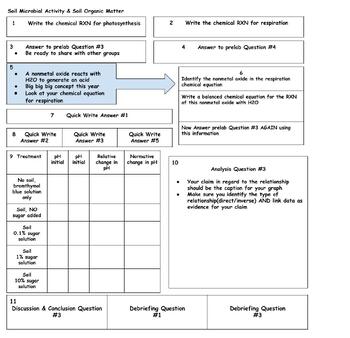
AP Environmental Lab Poster Template, Soil Microbial Activity & Organic Matter
Poster templates are designed to accompany the labs for the AP Environmental Science Course. As teams of students conduct the labs, they constantly document information they collect from the prelab, data collection, and the analysis portion. A template for students to follow is presented and as a team complete the poster. I generally have them make posters on butcher paper and we hang them in the hall as a resource they can look at throughout the year. They were also a great review tool this
Subjects:
Grades:
11th - 12th
Types:
CCSS:
NGSS:
HS-ESS3-2
, HS-ESS3-6
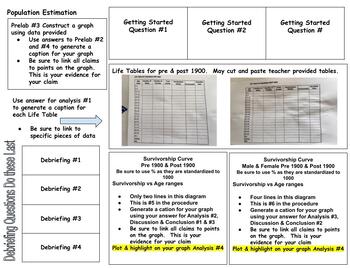
AP Environmental Lab Poster Template, Population Estimation
Poster templates are designed to accompany the labs for the AP Environmental Science Course. As teams of students conduct the labs, they constantly document information they collect from the prelab, data collection, and the analysis portion. A template for students to follow is presented and as a team complete the poster. I generally have them make posters on butcher paper and we hang them in the hall as a resource they can look at throughout the year. They were also a great review tool this
Subjects:
Grades:
11th - 12th
CCSS:
NGSS:
HS-LS2-1
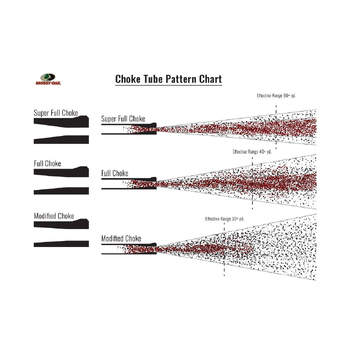
Ballistics Shotgun Spread Lab
Depending on the type of choke a shotgun has or the size of the shot (pellets fired) itself, the shot will disperse in a very predictable pattern. It will disperse in a circular pattern, and that pattern's diameter will change depending on how far away the target was.In this lab, the students will learn about the different types of chokes and how they disperse their shot. They will then do the following:Measure shot diameter from different chokes and shot diameterScale up these measurements from
Subjects:
Grades:
9th - 12th
Types:
StayGiant Candy Mix Bundle: Lab Investigations
All of the materials including in this bundled Strategic Instruction download are available as individual products sold separately on TpT in the ScienceGiant store. Please click on each link to receive a detailed description. [BE ALERT TO STUDENT’S FOOD ALLERGY WARNINGS! Products may contain nut and other allergens].Teachers use the Strategic Instruction Model (SIM) Framing Routine to transform abstract main ideas and key topics into a concrete representation that helps students think about and
Subjects:
Grades:
6th - 12th
Types:
Graphing with SULTAN
To teach my students to create excellent graphs in their labs and experiments, I use the acronym SULTAN. It is a simple 6 point checklist rubric to ensure that graphs in science are created clearly and accurately. SULTAN stands for:ScaleUnitsLabelsTitleAccuracyNeatnessI find this to be a clear, concise way to help students capture the key elements of an effective graph. It also makes for a handy rubric and way to provide quick targeted feedback on student graphing skills once they know SULTAN
Subjects:
Grades:
5th - 10th
Types:
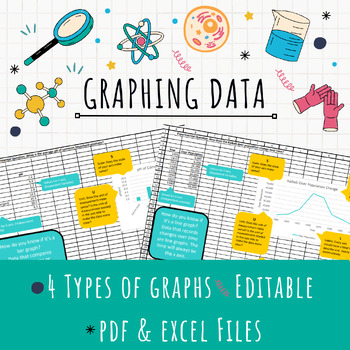
EDITABLE Excel Graphing Template
Teach graphing in Excel with this EDITABLE template! After collecting data, have your students represent it in a formal graph using Excel. This template provides helpful tips for students to determine the right kind of graph (bar, line, or pie) for their data and ALSO teaches them all the important parts of a graph.Assign the template for students to download and edit for a quick graphing solution or provide the pdf handouts for students who just need a little guidance!4 different kinds of graph
Grades:
7th - 12th
Types:
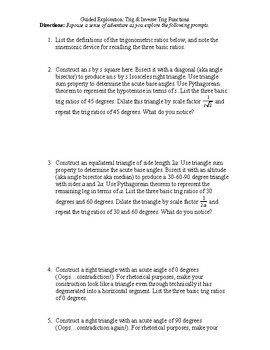
Guided Exploration: Trig & Inverse Trig Functions
35-item teacher-lead inquiry into properties and behavior of Trigonometric/Inverse Trigonometric Functions. Best used at the beginning of a unit on trigonometric/inverse trigonometric functions (before demonstrating how to solve textbook problems), this activity invites students to use inductive reasoning and class discussion to discover the big ideas behind graphing trigonometric/inverse trigonometric functions without a graphing utility.
Subjects:
Grades:
10th - 12th
Types:
CCSS:
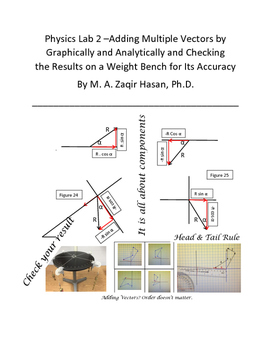
Physics Lab 2 - Adding Multiple Vectors by Graphical and Analytic Methods
The best lab you can do to teach your students how to add multiple vectors by graphical and analytic method. It shows the graphical method of adding vectors in step-by-step method starting from selecting the scale.
The graphical method is followed by the analytic method in great detail. An extensive discussion is available in breaking a vector in to two components perpendicular to each other. Students usually find it difficult to break a vector in its components.
Finally, the result is verified
Subjects:
Grades:
10th - 12th
Types:
Micro:bit Accelerometer Funcamentals
This lesson demonstrates how to use and gather information from the Micro:bit accelerometer. Use this lesson to reference lessons in science and math.The accelerometer measures motion and acceleration. Use this information to reference concepts learned in science on mass, motion, acceleration, and velocity. Use the sensor to measure motion, acceleration, and velocity.The accelerometer measures acceleration along the x, y, and z planes. Use this information to reference the coordinate plane used
Subjects:
Grades:
3rd - 12th, Higher Education, Adult Education, Staff
Types:
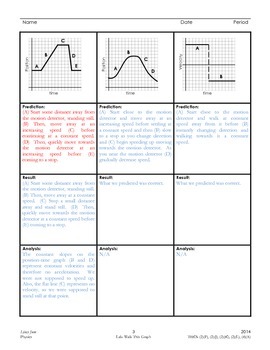
Lab: Walk This Graph
NOTE: This lab is only meant for those who have motion detectors and the appropriate equipment to connect to the motion detectors.
In this lab, students will analyze different position-time and velocity-time graphs and predict how they can mimic the graph by walking in front of a motion detector. Then, they will test and assess their predictions.
Grades:
10th - 12th
Types:
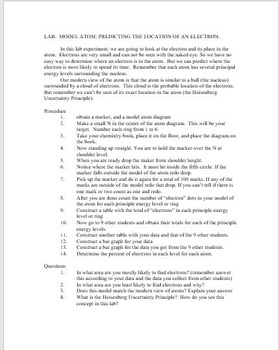
LAB ACTIVITY: ATOMIC STRUCTURE
This lab is a fun and easy way to demonstrate a few concepts concerning atomic structure namely the modern view of the atom (simplified) and Heisenberg's Uncertainty Principle. the students will need only the provided target diagram and a pen, though they may go through several pens. I used the cheap pens with the fine points. You can use cheap markers just make sure you have enough of them as the tips tend to break. Use fine tip markers this reduces the amount of splatter that can occur. Th
Subjects:
Grades:
7th - 12th
Types:
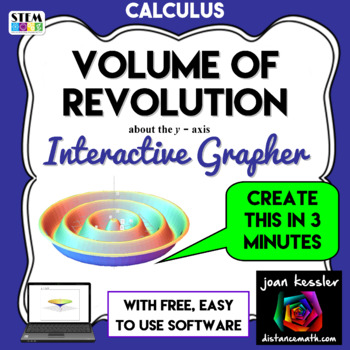
Calculus Interactive Volume of Revolution y-axis Grapher
This Calculus Interactive Volume of Revolution Surface of Revolution about the y-axis Grapher will wow your kids with LIVE interactive math explorations and animations. My students think this is awesome. This Easy 3D grapher will demonstrate and explore the volume of revolution in your classroom as never before. Incorporate this applet into your traditional lessons, Power Points, or Smart Board lessons or use as a free standing "app" to explore with your class. "What do you think would hap
Subjects:
Grades:
11th - 12th, Higher Education
Types:
Quest- The Skulip Grower, A Graphing Comprehensive Activity with 4 Graph Types
A quest that covers 4 different graph types with one activity! Use as a formative or summative assessment to engage your class with its strange premise! Ever need an engaging activity that promotes students to collect data and then use that data to generate bar graphs, pie graphs, line graphs, and scatter plots? Need an activity that has a Halloween theme that reviews some basic tenets on measuring and graphing? Look no further! I present the Skulip Grower Quest!In this activity students will ta
Subjects:
Grades:
6th - 9th
Types:
Discovering Transformations in RIGID Motion with Geogebra (Instructor Bundle)
Discovering Transformations in RIGID Motion with Geogebra (Preview) is a lesson that includes almost all of the Geometry Congruence Common Core State Standards in an activity that allows students to explore the concepts of TRANSLATION, REFLECTION, ROTATION, and CONGRUENCE by SSS, SAS and ASA using Geogebra, an online geometry web application.
The pages included in the INSTRUCTOR COPY are:
-- Student Copy pp. 1-13, 28-29 (Contents)
-- 3 Step-by-Step Guided Activities
-- 6 Questions Re
Grades:
9th - 12th
Types:
CCSS:
Math Lab An Algebra Review Via Hands-on Glider Investigation
Please join me in my enthusiasm for Math Lab Investigating Gliders!The lab is a two day event that covers and reviews multiple concepts covered in Algebra I, semesters I and II* It is outstanding for bringing concepts back to students prior to finals and for assisting them in applying mathematics to real life situations.* This 50 page investigation requires the student to address the relationship between the wing-span of a glider and the distance that it can fly.* On day one, students work in
Subjects:
Grades:
7th - 12th, Higher Education, Adult Education
Types:
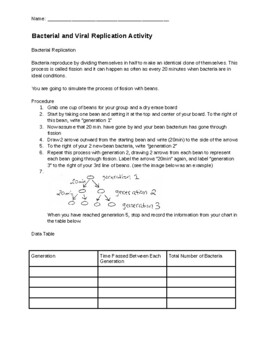
Bacterial and Viral Replication Lab
This lab requires you to have raw beans (any kind to model bacteria) and whiteboards for students to draw a family tree and write out generation numbers next to each bacterial generation. (You could also do this on paper.)This lab is a great way for students to simulate bacterial and viral reproduction. For the bacteria, students will model the number of bacteria in each generation starting with only one bacterium (represented by a bean). With each generation, students will watch as the family t
Subjects:
Grades:
8th - 9th
Dish Soap Bubble Lab and Class Discussion
This lab can be used in the beginning of the school year to help break the ice in the classroom and to investigate how soap affects the surface tension of water. There will be three different soaps selected by the teacher from the dollar store. There are class discussions, collaborative work and research. Each lab group of three will test the efficiency of each soap by measuring bubbles created with each type of soap and determine which soap makes the best bubbles.
Grades:
6th - 9th
Types:
Showing 1-24 of 36 results


