6 results
High school statistics cultural activities for Microsoft Word
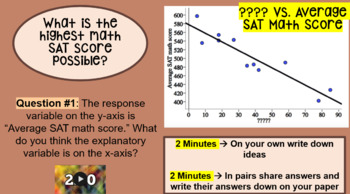
Stats: Inequities in Student Achievement & Poverty (PPT, NOTE SHEET-KEY, CFU)
Empower students to be able to interpret relevant data and make informed decisions based upon that data.Activity Based Learning where students experience first and then formalize their thoughts later.Extremely relevantMath discourse- a lot of room for conversation and critical thinkingProblem solving, reasoning, representation, communication, and connections … Oh my!When and Whereo Pre-Algebra/Algebra 1/Algebra 2: Linear Functions and Equationso Data and Statistics: Analyzing Two-Variable Datao
Subjects:
Grades:
9th - 12th
CCSS:
Social Justice in Middle School Math #3
This is the third worksheet of word problems for middle school math that highlight some of the social justice issues that are being addressed around the country. This particular worksheet is predominantly percent and proportion problems. See my two previous worksheets for other math topics. Math teachers should not and cannot stand by and let Social Studies and ELA teachers discuss social justice. Students should hear the facts from all teachers, and be educated so that each student can form his
Subjects:
Grades:
6th - 10th
Also included in: Social Justice in Math BUNDLE--NEW
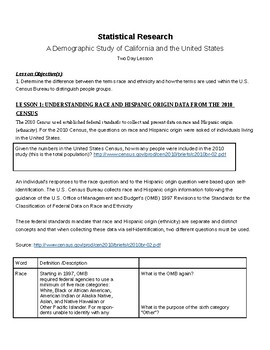
Statistical Analysis: U.S. Census Data Overview
This lesson uses data from the 2010 U.S. Census to allow students to access numbers and data in a social science classroom. The lesson is a 2 day mini-unit centered on working with charts, graphs, and tables (serves extremely well for SAT and ACT prep). This cross-curricular lesson draws meaningful parallels between math and social science, and the necessity of bringing these subjects together. The lesson uses a comparative look at Census data for California and the United States as a whole, but
Subjects:
Grades:
9th - 12th, Higher Education
Types:
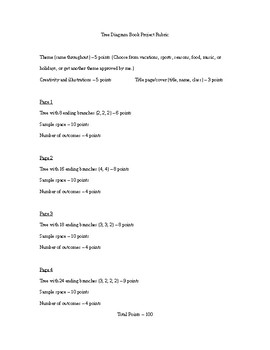
Tree Diagram Book Rubric
Students choose a broad topic and make 4 pages of tree diagrams with number of outcomes and sample spaces based on more specific parts of the broad topic. For example, students can choose Seasons as the broad topic and a different season for each page, or they can choose Types of Foods as the broad topic and a different type of food for each page. The categories and choices break down the topic into even more specific parts, and the choices make up the sets of branches in the tree.
Subjects:
Grades:
9th - 12th
Types:
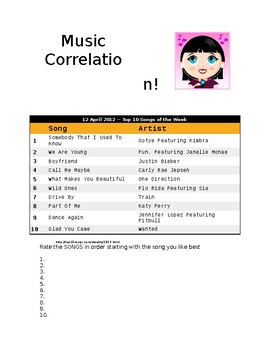
Music Correlation
Students rate the Top 10 songs and partner up. They plot their ratings and their partners' ratings and check for positive, negative, or no correlation. This can be adapted to any 10 songs of any genre.
Subjects:
Grades:
6th - 12th
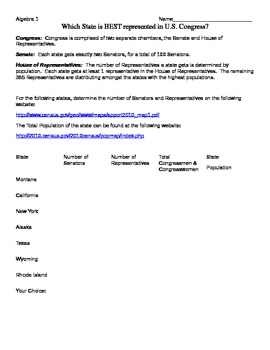
US Congress Ratios
This activity examines how each state is represented in the House of Representatives, Senate and Congress overall. Students examine what a low ratio of population to representatives means and what a high ratio of population to representatives means. Which states have the "best representation" and which states have the "worst representation".
Subjects:
Grades:
8th - 12th
Types:
Showing 1-6 of 6 results


