156 results
High school statistics projects for Microsoft Word
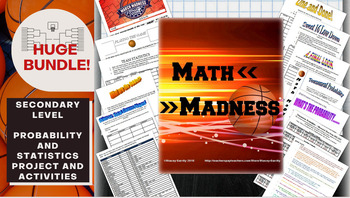
Math March Madness Full Tournament Project {BUNDLE}
Harness the excitement of NCAA March Madness with this huge project for secondary math teachers that follows all stages of the tournament! This Common Core aligned bundle comes with bonus parts not sold individually in my store so you can create a rich immersion in the tournament, practice probability and statistics and learn some interesting new ones along the way! Save $3 plus get bonus content by bundling!You can pick and choose which parts you would like to incorporate, or follow my schedu
Subjects:
Grades:
6th - 12th, Higher Education
Types:
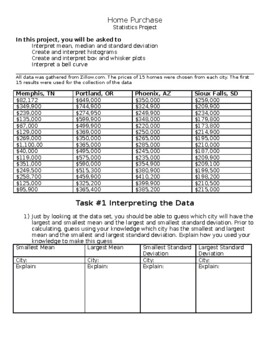
Home Prices: High School Statistics Project
This statistics project has students exploring home prices and using their knowledge of mean, median, standard deviation, histograms, box and whisker plots, and bell curves to make predictions and inferences about the data. This project is provided in a word document to allow the teacher the ability to edit the document or load it to a google doc. In this project students first make predictions about measures of spread and central tendency without calculating but by looking at the data. Students
Subjects:
Grades:
9th - 12th
Types:
CCSS:
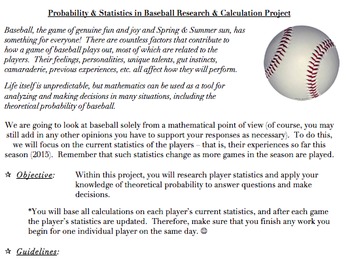
Probability & Statistics in Baseball Project (Common Core Aligned, AND FUN!)
The problems and activities within this document are designed to assist students in achieving the following standards: 6.SP.B.5, 7.SP.C, HSS.CP.A.2, HSS.CP.A.3, HSS.CP.B.7, HSS.CP.B.9, as well as the standards for mathematics practice and the literacy standards. They are also designed to help the teacher assess the students’ abilities when it comes to working with the ideas within the standards.This document contains the following:A project designed to allow students to investigate theoretical
Subjects:
Grades:
5th - 12th, Higher Education, Adult Education, Staff
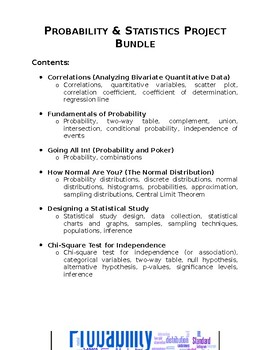
Probability & Statistics Project Bundle
A bundle that contains six different projects for a Probability & Statistics high school course. This bundle includes: Correlations (Analyzing Bivariate Quantitative Data) Fundamentals of Probability Going All In! (Probability, Combinations, and Poker) How Normal Are You? (The Normal Distribution) Designing a Statistical Study Chi-Square Test for Independence These projects are designed to engage students in authentic, hands-on, performance-based tasks. For each of these projects, students c
Subjects:
Grades:
9th - 12th
Types:
CCSS:
Statistics In My World Project
This is a great project for students to do at the beginning of a HS statistics class. It will open their eyes to statistics in the media and provides real world interpretation of material learned the first couple weeks of class. The best part - You get lots of decorations for your wall and material to use as you progress through descriptive statistics!
Package includes instructions for teacher, including CCSM standards and objectives; student handout outlining specifics of the project; gradi
Subjects:
Grades:
11th - 12th
AP Statistics Football Binomial + Geometric Probability Project Digital + PDF
NEW for 2020! This resource now includes a fully editable Google Doc link for remote or distance learning! Assign the Google doc to your students, and they can type their answers directly into the boxes and submit their work digitally. This packet includes the following: Seven probability questions that use football quarterback pass completion rate, and require the use of the following probability techniques to answer: · Geometric PDF · Geometric CDF · Complement of Geometric CDF ·
Subjects:
Grades:
10th - 12th
Types:
Also included in: AP Statistics Project Bundle! 6 Projects + digital versions
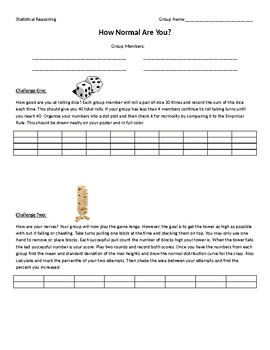
Normal Distribution Project
Students will complete in competitions to gather data. They will then use this data do check how normal the data is, perform the Empirical Rule test and more. There are 2 different versions of the projects because some require a jenga set.
Subjects:
Grades:
8th - 12th
Types:
Create Your Own Statistics Project
This document contains a statistics project description that allows students to create their own project. This is suitable for high school and beginning level college statistics class. Students will design their own study - formulate research questions, collect data, organize and summarize the findings, calculate confidence interval and construct hypothesis testing. Certain restrictions are outlined in the document. Students will experience the complexity of constructing their own study. They ar
Subjects:
Grades:
10th - 12th, Higher Education, Adult Education
Types:
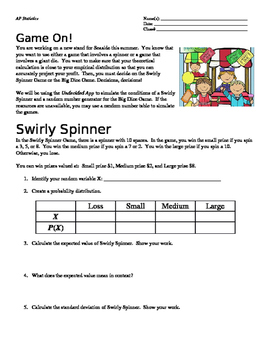
Game On! Hypothesis Testing: 1-Sample t-Test for Means Lab
This lab asks students to apply concepts of 1-sample t-test of means in a real world context. They are able to play/simulate games and determine if their theoretical calculation is accurate.
This lab integrates hypothesis testing based on two carnival games. Spiraling expected value and random variable topics from previous chapters will help themto prepare them with a "big picture" when it comes to the AP Statistics Exam.
(For the high flyers: It also asks students to develop of higher orde
Subjects:
Grades:
10th - 12th
Types:
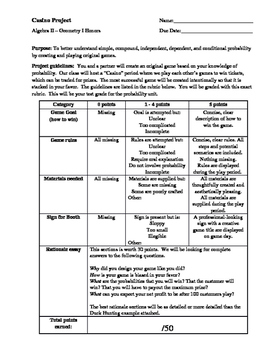
Carnival Probability Project
A project that feels like a game!
Students must create their own game, using probability to ensure THEY are favored to win....much like the house in a casino. Students can make games involving dice, spinners, cards, "fishing" ducks out of a pond, etc.
Assessed skills include: fundamental counting principal, theoretical probability, experimental probability, independent events, dependent events, creativity, writing, presentation. *Students must already know basic probability to complete this
Subjects:
Grades:
8th - 12th
Types:
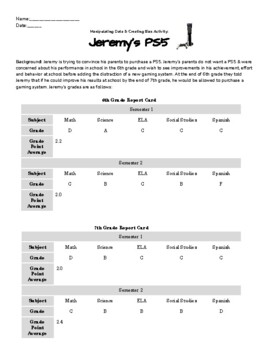
Manipulating Data & Creating Bias Activity
Manipulating Data & Creating Bias Activity: Teach your students about how charts and statistics can be skewed; and real numbers can reflect bias with this fun project! Students are given a role (either Jeremy or his parents) and have to use two pieces of data from Jeremy's 6th & 7th grade report card to argue for or against his deserving of a PS5!Students get to be creative & make cross-curricular connections to ELA as they use logical fallacies & skewed graphs to make their argu
Subjects:
Grades:
4th - 11th
Types:
CCSS:
NGSS:
HS-ETS1-4
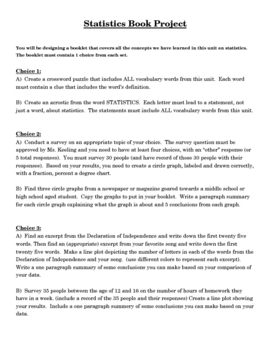
Data & Statistics Final Project
This final assessment covers topics from a data and statistics unit at the middle school level. The project covers such topics as histograms, bar graphs, circle graphs, line plots, scatter plots, misleading graphs, measures of center (mean, median, mode)and any vocabulary from the unit. The project directions give the students two choices of activities for each of the topics listed above to complete as a final assessment. For example, the section that checks for their proficiency of circle gra
Subjects:
Grades:
6th - 9th
Types:
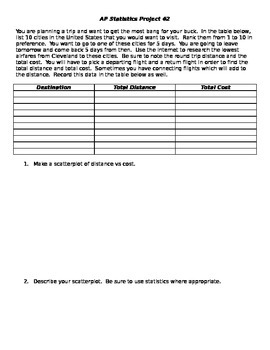
Linear Regression Project
This is a project about linear regression where the students research 10 cities that they want to visit. They use the internet to research flights and record the total distance and the total cost of the flight. They then do some analysis of the data
Subjects:
Grades:
8th - 12th
Types:
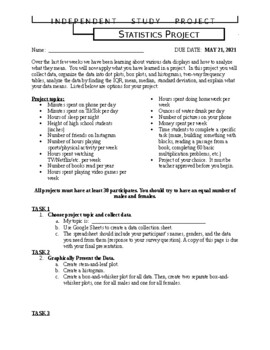
Algebra 1 - Statistics Project
Tired of doing tests? Especially by the time you get to the statistics chapter, you and your students both probably are! Here is an alternative summative assessment for you!This statistics project tasks students with conducting a survey to collect data. Then, students must graphically represent the data, analyze the data by performing statistical calculations, and interpret the data.Students really enjoy this project!!
Subjects:
Grades:
7th - 10th
Types:
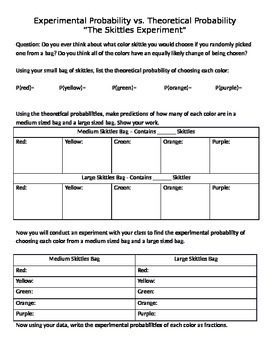
Skittles Probability Experiment
This experiment allows students to explore the differences between experimental and theoretical probability.
Materials:
One large bag of Skittles
One normal bag of Skittles
One Fun Size bag of Skittles for each student
Subjects:
Grades:
5th - 12th
Types:
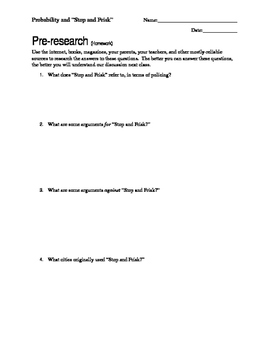
Using Probability to Teach Social Justice
This is an exploratory experiment/activity about basic probability. Students discover the differences between theoretical probability, experimental probability, and reality by taking a hard look at Stop and Frisk in urban areas. Students also deal with independent and dependent events.
By the end of the project, students will be able to:
Articulate the differences between theoretical and experimental probability through prediction and experimentation.
Articulate the differences between indep
Subjects:
Grades:
8th - 12th
Types:
CCSS:
Experimental Design- Old Wives Tale Project and Presentation: Prob & Stats
This project is a fun way to assess your students' knowledge of Experimental Design. Students will choose an Old Wives Tale from a list and design an experiment they could use to test the validity of the Old Wives Tale. This project is great for small groups, but also works well for individuals. The document contains a Project Details sheet you can give your students for directions, and a scoring guide you can use for grading the projects. The download is a completely editable Word document.
Subjects:
Grades:
9th - 12th
Types:
CCSS:
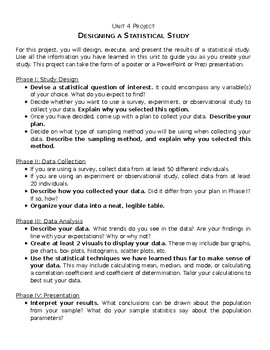
Project: Designing a Statistical Study
Project guidelines and rubric for a project on statistical study design. Students design their own statistical study, collect their own data, create charts to display their data, and make inferences based on their findings. Once completed, students present their findings to the class.
Subjects:
Grades:
9th - 12th
Types:
CCSS:
Two-way table Project
This project is designed to help students understand bivariate data association through the creation of a two-way table. Students need to randomly select 90 students to survey two questions of their choosing. The students need to choose two questions that compare things they think may have a relationship. This project provides students with the boxes to record results, create their two-way table, and create relative frequencies to analyze the results. Finally, this project comes with a grading r
Subjects:
Grades:
8th - 11th
Types:
CCSS:
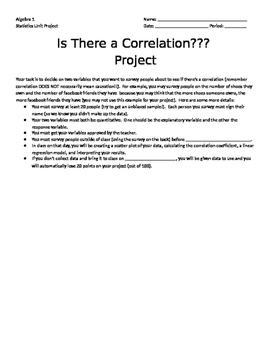
Correlation Project
This is a project I have done at the end of a Statistics unit in Algebra 1. Students survey at least 20 people with two quantitative questions and do a correlation study. The students make a scatter plot and find the line of best fit. Then, they find the linear regression and r value in a calculator and interpret them.
Subjects:
Grades:
9th - 11th
Types:
CCSS:
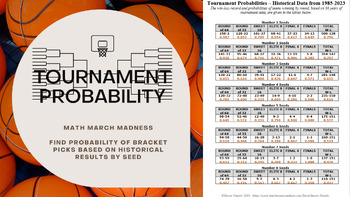
Math March Madness - Bracket Probabilities (Based on Historical Data by Seed)
One of the most interesting looks at predicting winners of the tournament! I have compiled data from 1985 (when the tournament went to 64 teams) through 2023 of the wins and losses by seed in the tournament. Students will use this data along with a bracket that they fill out to see what the probability is of their picks making it to various stages, their chances of all of their final four teams making it this year, and more! Very fun and very interesting answers! Students primarily use "And"
Subjects:
Grades:
6th - 12th, Higher Education
Types:
CCSS:
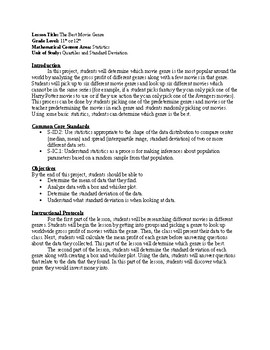
Best Movie Genre (Statistics Project)
People around the world love movies. Huge Blockbuster hits like Harry Potter, the Avengers, and The Fault in Our Stars made millions of dollars worldwide. But which movie genre is the best genre to invest in and around the world? For this project, students will be able to pick two movie genres and three different movies within each genre to determine the best movie genre of all time by looking at the gross profit the movie made around the world. They will share their data with the rest of the cl
Subjects:
Grades:
11th - 12th
Types:
CCSS:
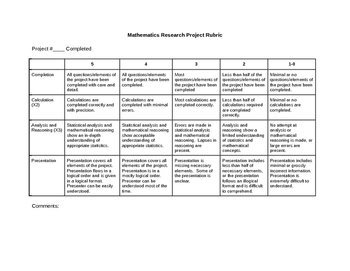
Math or Statistics Research Project Rubric
This editable rubric contains fields for project completion, calculation, analysis and reasoning, and presentation on a scale of five to one. It was originally designed for the Alberta Math 20-2 mathematics research project requirement, but is suitable for use across junior and senior high.
Subjects:
Grades:
9th - 11th
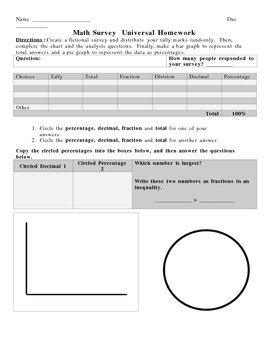
Take A Survey -- Learn Fractions, Percents and Decimals
This is a project that helps students learn to compute fractions, decimals and percents. The preview is a "universal" homework that students can complete for review any time during the year.
Take A Survey -- Learn Fractions, Percents and Decimals by Sherre Vernon is licensed under a Creative Commons Attribution-Share Alike 3.0 United States License.
Subjects:
Grades:
6th - 12th, Higher Education, Adult Education
Showing 1-24 of 156 results


