54 results
High school statistics centers for Microsoft Word

Candy Probability: Discovery of EXPERIMENTAL vs. THEORETICAL Probability
Middle Schoolers LOVE probability!
This is a GREAT lesson around Halloween when the kids are already hyped up on sugar and want to 'talk' to their classmates.
This activity allows the students to DISCOVER the differences between EXPERIMENTAL and THEORETICAL probability and connect it to everyday experiences. The probability lesson lends itself to fractions, decimals, percents, data collection, rational & irrational numbers, statistical graphs (box and whiskers, frequency tables...), measu
Subjects:
Grades:
5th - 9th
Types:
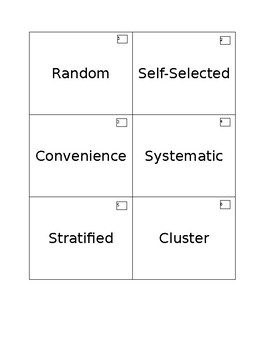
Sampling Methods Matching Activity
18 cards included. Students match six types of sampling methods (random, cluster, stratified, convenience, systematic, and self-selected) with their definitions and an example of each type. Teacher answer key included for easy assessment. When students are finished, they should have 6 groups of 3 cards each for teacher/other group to check.
Subjects:
Grades:
9th - 12th
Types:
CCSS:
Would You Rather Two Way Tables
Would you rather be rich and fat or poor and skinny? Would you rather have a light saber or helper monkey? Do boys and girls respond differently to such questions? Students will survey classmates and then analyze the results using two way tables. Addresses Common Core Math Standard 8.SP.A.4.
Subjects:
Grades:
8th - 10th
Types:
CCSS:
Permutations and Factorial Notation Worksheet (17 Questions)
Permutations and Factorial Notation Worksheet17 Questions with the solutions1 page for the questions1 page for the answers* AlSO AVAILABLE FOR YOU OR A COLLEAGUE! - CLICK ANY LINK YOU WANT:Probability & OddsMean, median, mode, range, line plot, and Box and whisker WorksheetStatistical Math (GED REVIEW)The Binomial Theorem Worksheet (10Q)Theoretical Probability WorksheetProbability Word Problems (Worksheet) You may also be interested in my other top-selling products: EQUIVALENT FRACTIONS (33
Subjects:
Grades:
9th - 12th, Higher Education, Adult Education, Staff
Types:
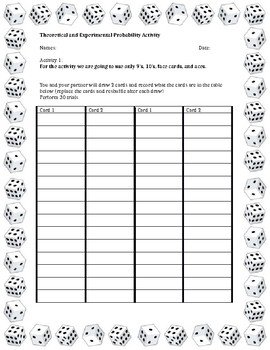
Theoretical and Experimental Probability Activity
These activities have students interact with playing cards and dice to practice with theoretical and experiment probability. Questions on the worksheet vary in difficulty.
Subjects:
Grades:
7th - 10th
Types:
CCSS:
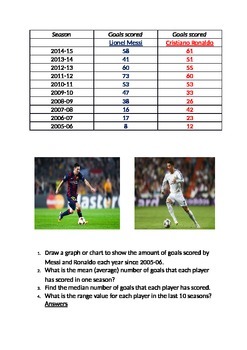
Messi v Ronaldo - mean, mode, median, range.
Data handling with a soccer twist. Find the mean, median, mode and range of the goals scored by the extraordinary Lionel Messi and Cristiano Ronaldo over the last 10 years, and create a variety of graphs and charts in the process.
Subjects:
Grades:
5th - 12th
Types:
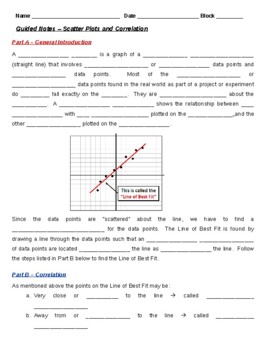
Guided Notes - Scatter Plots and Correlation (Student & Teacher Versions)
This MS Word file is a Guided Notes document that reviews both the concept and steps involved in solving and developing Scatter Plots for linear equations or functions. It also includes a review of Correlation and how to calculated it using a graphing calculator. I use these notes with my Math 1, Math 2 and Algebra 1 students immediately after I introduce this concept with my PPT presentation slidepack on the same subject. It is 3 full pages of notes for the students to complete and includes t
Subjects:
Grades:
8th - 11th
CCSS:
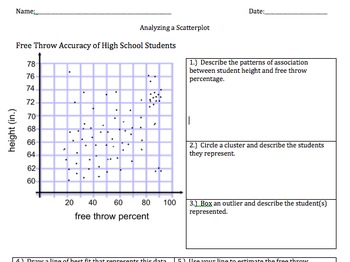
8.SP.1 and 8.SP.2 Analyze a Scatterplot
This activity hits the main intent of both 8.SP.1 and 8.SP.2. Engage students with a scatterplot relevant to their lives that explores the association between student height and free throw accuracy. They describe whether the association is linear or non-linear, positive or negative, strong or weak. Students will also identify clusters and outliers and predict what they represent. (For example, the outlier who is really tall but a really bad shot may be a center, like Shaquille O'Neal whose e
Subjects:
Grades:
7th - 9th
Types:
Chi Square Lab for AP Biology
I use this activity to introduce chi square to my students in AP Biology.It scaffolds their learning so that we walk through the definitions and basic concepts, then dive right into practice problems. We used AP biology examples, M&M color distributions, and practice genetics problems to understand how to calculate and use the chi square value.The students are always super engaged throughout the lesson and generate their own data for may of the components of the lab.By the end of the lesson,
Subjects:
Grades:
10th - 12th
Types:
Common Core Rich Math Task in Data Management NO PREP
Looking for a rich math task that aligns with the common core standards? This math project is used for the data management outcome. Use this project to teach the entire unit. This project has exemplars to use as guides for students. Have students brainstorm their own survey and census questions!
--------------------------------------------------------------------
What's included?
- Step by step instructions on how to conduct a survey or census
-A copy of a 5 page census survey, created by my o
Subjects:
Grades:
5th - 12th
Types:
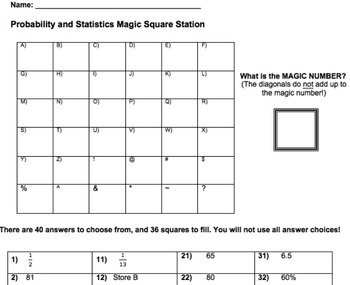
Probability and Statistics Magic Square Activity
This magic square activity is a fun and engaging way to review probability and statistics skills! The students work to solve each problem while also determining what the "magic number" is. The student worksheet and activity are included. My 7th graders loved working on this for an end of the year review assignment!
Subjects:
Grades:
6th - 9th
Types:
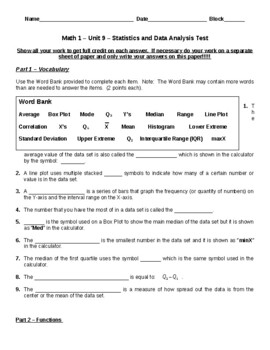
Math 1/Algebra 1 Assessment/Practice Test - Unit 9 Statistics and Data Analysis
This MS Word file is a Math 1/Algebra 1 Assessment / Practice Test for:Unit 9 - Statistics and Data Analysis It consists of seventeen (17) questions and one (1) extra credit item. I used to use this document as my assessment for Unit 9 of my 8th Grade, Math 1 and Algebra 1 classes. Since I now use an online program for all of my math assessments, I now use this document as a practice test the day before I give the online assessment. It is fourteen (12) pages in length, including the Teacher A
Subjects:
Grades:
7th - 10th
Types:
Also included in: Math 1/Algebra 1 Assessment/Practice Tests - Units 1-10 Bundle
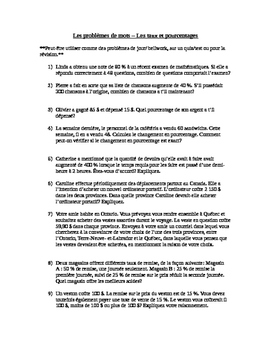
FRENCH math- Les pourcentages, rapports et taux - rates, percentages and ratios
17 FRENCH word problems that can be used for Bellwork, problem of the day or on a quiz or test. Made to go along with the percentages, ratios and rates unit in Ontario.
**Peut-être utiliser comme des problèmes de jour/ bellwork, sur un quiz/test ou pour la révision.**
Subjects:
Grades:
7th - 10th
Types:
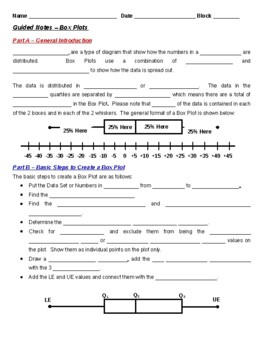
Guided Notes - Box Plots (Student & Teacher Versions)
This MS Word file is a Guided Notes document that reviews both the concept and steps involved in solving and producing Box Plots. I use these notes with my Math 1, Math 2 and Algebra 1 students immediately after I introduce this concept with my PPT presentation slidepack on the same subject. It is 2 full pages of notes for the students to complete and includes the detailed steps that I teach my students to use to solve and produce Box Plots. The 3rd page includes an example problem that is wo
Subjects:
Grades:
8th - 10th
CCSS:
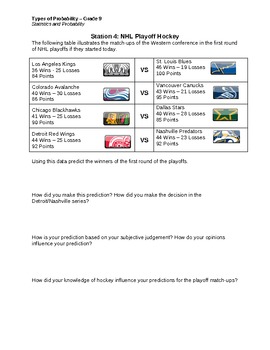
Exploring Probability - Hands on Station Activities
This file has students exploring different kinds of probability (experimental, theoretical, and subjective judgement). The stations allow students to work in hands on situations, and reflect on their learning. I have used this activity with much success - the students enjoyed that it was hands on and included examples related to the NHL and popular contests.
Subjects:
Grades:
6th - 12th
Types:

Two-Way Frequency Table Activity
8.SP.4 8th grade Common Core statistics. Students survey fellow classmates and make a two-way frequency table. Questions involving marginal relative frequencies and joint relative frequencies follow.
Subjects:
Grades:
7th - 9th
Types:
CCSS:

Paper Airplane Palooza
This download is a hands on project that teaches students about data collection, analyzing data and graphing data. Paper plane types are listed, but directions to fold will have to be searched online.
Subjects:
Grades:
4th - 9th
Types:

Statistical Math (GED REVIEW)
Statistical Math
Data analysis statistics and probability worksheets ,63 problems
GED Review
Fraction and Data (29 Multiple choice questions)
Statistic Problem (15 questions)
Probability Word Problems
This section contains 19 word problems about :
Simple Probability
Counting Principle
Independent Probability
Dependent Probability
Mutually Exclusive Events
Permutations
Combinations
Conditional Probability
* AlSO AVAILABLE FOR YOU OR A COLLEAGUE! - CLICK ANY LINK YOU WANT:
Geometry (GED R
Subjects:
Grades:
9th - 12th, Higher Education, Adult Education, Staff
Types:
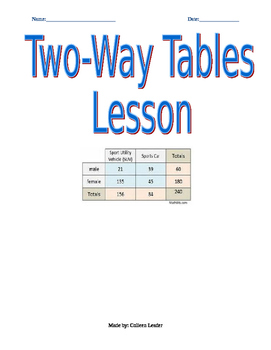
Two-way table Lesson
This lesson provides you and your students a walk-through of creating and analyzing bivariate data in a two-way table. There are also some example scenarios that students need to analyze the two-way table and determine relative frequencies.
Describing Data Scavenger Hunt (Algebra Unit 6)
This is a review that I use at the end of the Stat unit. Questions are multiple choice and require some higher level thinking with comparing and contrast. Topics include: mean, median, mode, mean absolute deviation, box and whisker plots, line of best fit, and correlation coefficients. There is an answer sheet provided where students can write their answers as well as an answer key. This is a word document so feel free to edit as needed.
Subjects:
Grades:
9th
Types:
Guided Notes - Scatterplots and Line of Best Fit (Teacher & Student Versions)
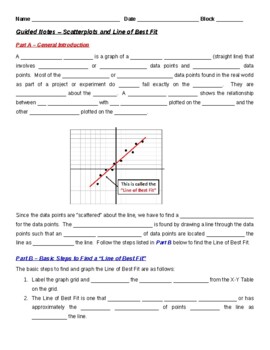
This MS Word file is a Guided Notes document that reviews both the concept and steps involved in solving and developing Scatter Plots and Lines of Best Fit for linear equations or functions. I use these notes with my Math 1, Math 2 and Algebra 1 students immediately after I introduce this concept with my PPT presentation slidepack on the same subject. It is 3 full pages of notes for the students to complete and includes the detailed steps that I teach my students to use to develop and graph a
Subjects:
Grades:
8th - 10th
CCSS:
Probability of Compound Events Task Cards
This is a set of 6 task cards with 3 compound probability questions per card. Task cards can be used in games, math centers, or class activities. A coordinating student worksheet is also included. Students must write the fraction to represent each event and solve as a fraction and a percent. Task cards also ask students to identify the scenario as an independent or dependent event.
Probability of Compound Events Task Cards by Suzie's Angle is licensed under a Creative Commons Attribution
Subjects:
Grades:
6th - 9th
Types:
CCSS:
Theoretical vs. Experimental Probability
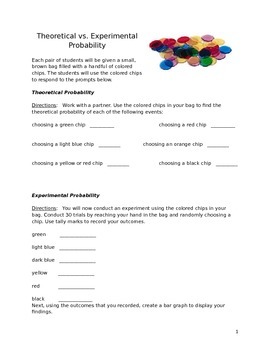
This is a hands-on activity focusing on theoretical vs. experimental probability. Students will work in partners to complete the activity. Each pair of students will be given a small, brown bag filled with a handful of colored chips. The students will use the colored chips to find the theoretical probability and experimental probability of choosing specific colored chips. The students will then be asked to compare the outcome of the theoretical probability and experimental probability.
This a
Subjects:
Grades:
4th - 9th
Types:
Guided Notes - Histograms (Student and Teacher Versions)
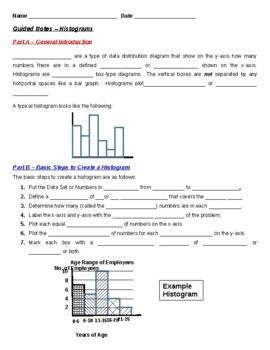
This MS Word file is a Guided Notes document that reviews both the concept and steps involved in developing Histograms. I use these notes with my Math 1, Math 2 and Algebra 1 students immediately after I introduce this concept with my PPT presentation slidepack on the same subject. It is 1-1/2 pages of notes for the students to complete and includes the detailed steps that I teach my students to use to properly develop and analyze Histograms. The 2nd page also includes an example problem that
Subjects:
Grades:
8th - 10th
CCSS:
Showing 1-24 of 54 results


