30 results
High school statistics scaffolded notes for Microsoft Word
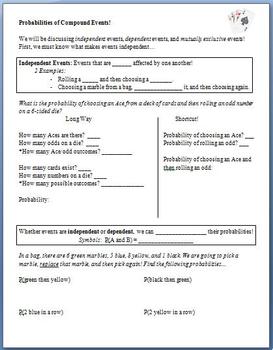
Probability of Compound Events (Guided Notes)
This lesson is meant to be used as guided notes for a whole class.
Students begin by learning what makes 2 events independent. After slowly working through a problem about rolling a die and choosing a card, they discover that they can multiply probabilities when working with these compound events. They then attempt problems involving picking marbles from a bag. Next, they learn about dependent events, and finally, mutually exclusive events.
The last 2 pages are a copy of the key.
Subjects:
Grades:
6th - 12th
Types:
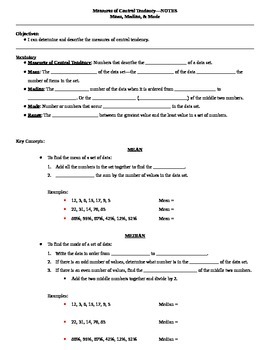
Measures of Central Tendency Guided Notes
These are guided notes for a lesson on measures of central tendency including mean, median, mode, and range. There are several examples in the notes and the same data sets are used to show each measure of central tendency.I have also included a teacher key to show you what to fill in the blanks as your students follow along.To use these notes, I simply projected them onto my whiteboard, gave the students their blank copies, and had them follow along and write what I wrote. This works great when
Subjects:
Grades:
5th - 12th
CCSS:
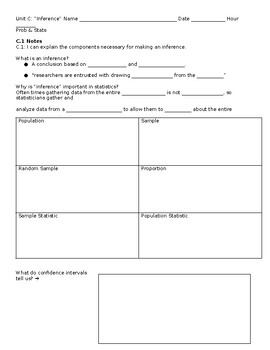
Probability and Statistics Unit C Inference Notes and Practices (All Materials)
Probability and Statistics Unit C Inference Notes and Practices (All Materials)
Subjects:
Grades:
9th - 12th
Types:
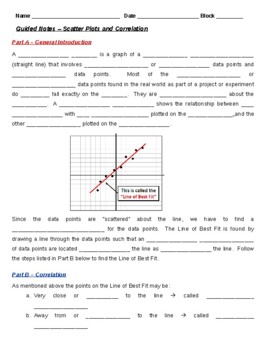
Guided Notes - Scatter Plots and Correlation (Student & Teacher Versions)
This MS Word file is a Guided Notes document that reviews both the concept and steps involved in solving and developing Scatter Plots for linear equations or functions. It also includes a review of Correlation and how to calculated it using a graphing calculator. I use these notes with my Math 1, Math 2 and Algebra 1 students immediately after I introduce this concept with my PPT presentation slidepack on the same subject. It is 3 full pages of notes for the students to complete and includes t
Subjects:
Grades:
8th - 11th
CCSS:
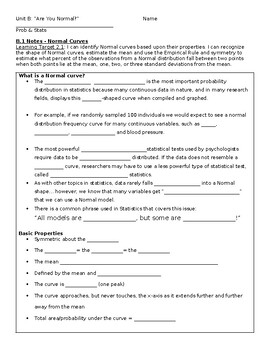
Probability and Statistics Unit B Normal Distribution Notes and Guides
Probability and Statistics Unit B Normal Distribution Notes and Guides (pairs With Unit B Powerpoint Lecture)
Subjects:
Grades:
9th - 12th
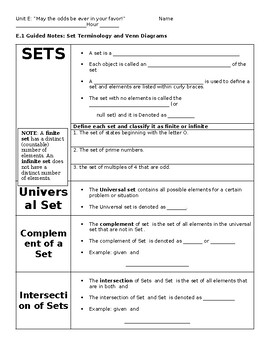
Probability and Statistics Unit E Probability Notes and Practices
Probability and Statistics Unit E Probability Notes and Practices
Subjects:
Grades:
9th - 12th
Types:
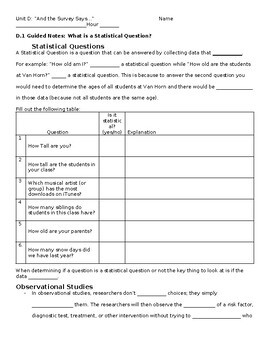
Probability and Statistics Unit D Statistical Experiments Notes and Practices
Probability and Statistics Unit D Statistical Experiments Notes and Practices
Subjects:
Grades:
9th - 12th
Types:
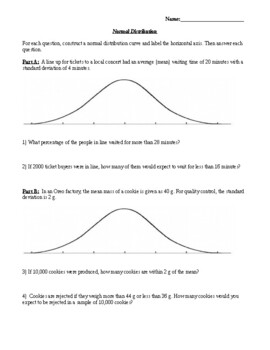
Normal Distribution with Normal Curves and Empirical Rule Worksheet and Key
This worksheet contains 4 normal curves where students are asked to label the curve given the mean and standard deviation. Then they answer questions about the normal distribution using the empirical rule.
Subjects:
Grades:
9th - 12th
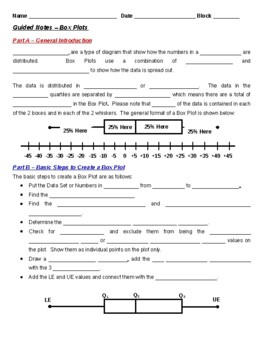
Guided Notes - Box Plots (Student & Teacher Versions)
This MS Word file is a Guided Notes document that reviews both the concept and steps involved in solving and producing Box Plots. I use these notes with my Math 1, Math 2 and Algebra 1 students immediately after I introduce this concept with my PPT presentation slidepack on the same subject. It is 2 full pages of notes for the students to complete and includes the detailed steps that I teach my students to use to solve and produce Box Plots. The 3rd page includes an example problem that is wo
Subjects:
Grades:
8th - 10th
CCSS:
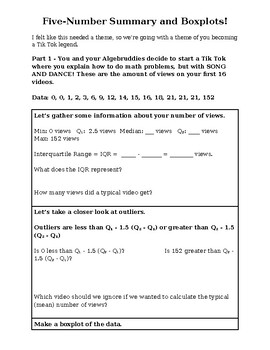
Scaffolded Review: Five-Number Summary and Boxplots
Scaffolded review worksheet for boxplots, five-number summaries, and outliers. Students analyze data related to starting a math tik tok channel, and use statistics to compare different videos. Fully editable if you want to remove scaffolding, add or subtract questions. Engaging, fun, and rigorous!
Subjects:
Grades:
8th - 11th
CCSS:
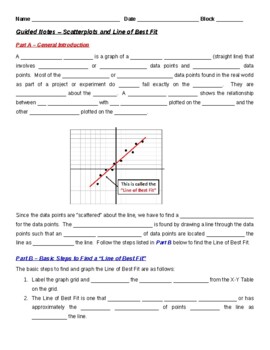
Guided Notes - Scatterplots and Line of Best Fit (Teacher & Student Versions)
This MS Word file is a Guided Notes document that reviews both the concept and steps involved in solving and developing Scatter Plots and Lines of Best Fit for linear equations or functions. I use these notes with my Math 1, Math 2 and Algebra 1 students immediately after I introduce this concept with my PPT presentation slidepack on the same subject. It is 3 full pages of notes for the students to complete and includes the detailed steps that I teach my students to use to develop and graph a
Subjects:
Grades:
8th - 10th
CCSS:
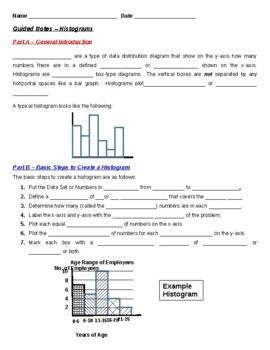
Guided Notes - Histograms (Student and Teacher Versions)
This MS Word file is a Guided Notes document that reviews both the concept and steps involved in developing Histograms. I use these notes with my Math 1, Math 2 and Algebra 1 students immediately after I introduce this concept with my PPT presentation slidepack on the same subject. It is 1-1/2 pages of notes for the students to complete and includes the detailed steps that I teach my students to use to properly develop and analyze Histograms. The 2nd page also includes an example problem that
Subjects:
Grades:
8th - 10th
CCSS:
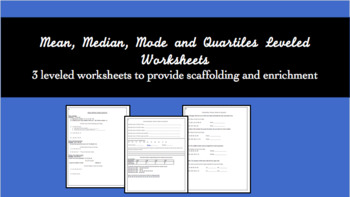
Mean, Median, Mode and Quartiles by Levels
Enclosed are 3 leveled worksheets for Mean, Median, Mode and Quartiles. Level A is designed for students who need guidance. The worksheet is designed to help guide students through the content. Level B is designed for students who need practice but understand how to find mean, median, mode and quartiles. Level C is designed for advanced students. The worksheet has them interpret mean, median and mode in context.
Subjects:
Grades:
6th - 9th
Types:
CCSS:
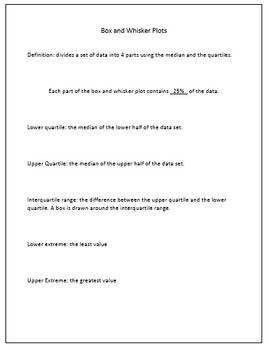
Box and Whisker Plots Scaffolded Notes
First page defines the different vocabulary words associated with box and whisker plots. Second page explains how to create a box and whisker plot step by step. I printed the first page for myself and erased the definitions for the students pages so they had to copy them, then completed each step on the second page with them and we created the graph together.
Subjects:
Grades:
6th - 9th
Types:
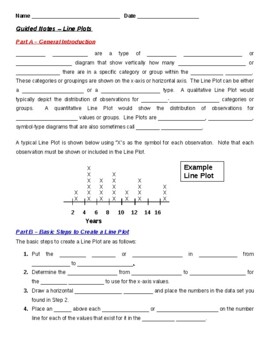
Guided Notes - Line Plots (Teacher and Student Versions)
This MS Word file is a Guided Notes document that reviews both the concept and steps involved in developing Line Plots. I use these notes with my general 8th Grade Math, Math 1, Math 2 and Algebra 1 students immediately after I introduce this concept with my PPT presentation slidepack on the same subject. It is 1-1/2 pages of notes for the students to complete and includes the detailed steps that I teach my students to use to properly develop and analyze Line Plots. The 2nd page also includes
Subjects:
Grades:
8th - 10th
CCSS:
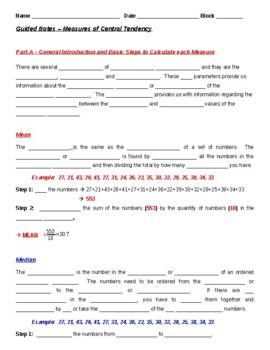
Guided Notes - Measures of Central Tendency (Teacher & Student Versions)
This MS Word file is a Guided Notes document that reviews both the concept and steps involved in determining the basic Measures of Central Tendency (Mean, Median, Mode and Range). I use these notes with my regular 8th Grade, Math 1, Math 2 and Algebra 1 students immediately after I introduce this concept with my PPT presentation slidepack on the same subject. It is 1-1/2 pages of notes for the students to complete which include the detailed steps that I teach my students to use to properly det
Subjects:
Grades:
8th - 10th
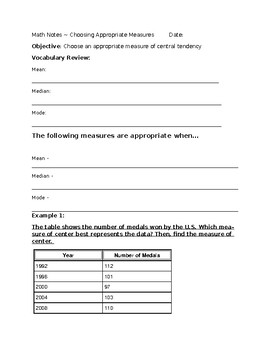
Appropriate Measures of Center
These are guided notes for teaching shape of distribution of a data set or data display. This is the ninth and final lesson of a Data Display and Analysis unit. These notes include the following:
Objective: Learn how to choose the appropriate measure of center to describe a data set
Vocabulary:
Mean
Median
Mode
The notes go over the following content with direct instruction, guided practice, and independent practice in mind:
- Defines vocabulary
- Describes when it is appropriate to use e
Subjects:
Grades:
6th - 9th
Types:
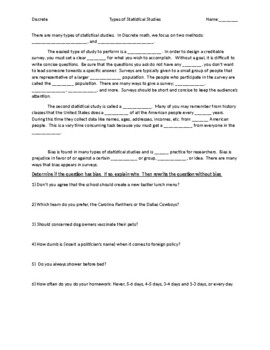
Statistical Studies: Surveys and Census with Bias Notes
This was a quick overview of the differences between surveys and censuses. The topic of bias was also part of the class discussion.
Subjects:
Grades:
8th - 12th
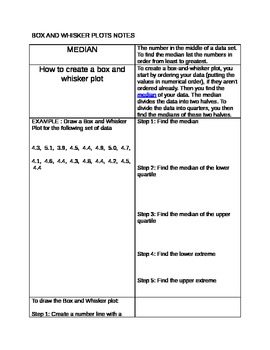
Box and Whisker Plot Notes
These notes were created to align with the Integrated 1 Common Core Curriculum (Unit 4 Data).
Subjects:
Grades:
7th - 12th
Types:
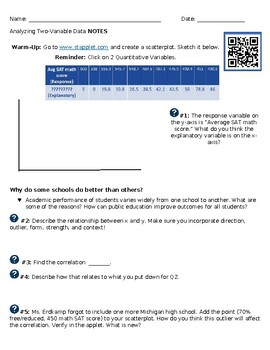
Stats: Inequities Between Student Achievement and Poverty Guided Notes
Empower students to be able to interpret relevant data and make informed decisions based upon that data.Activity Based Learning where students experience first and then formalize their thoughts later.Extremely relevantMath discourse- a lot of room for conversation and critical thinkingProblem solving, reasoning, representation, communication, and connections … Oh my!When and Whereo Pre-Algebra/Algebra 1/Algebra 2: Linear Functions and Equationso Data and Statistics: Analyzing Two-Variable Datao
Subjects:
Grades:
9th - 12th
Types:
CCSS:
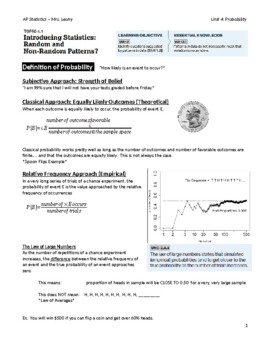
AP Statistics Unit 4 Guided Notes (Probability) Editable Word Document
AP Statistics Unit 4 Guided Notes (Probability, Random Variables, Distributions)This file is the editable word document version of the FREE download pdf version for the Unit 4 Notes.
Subjects:
Grades:
9th - 12th
Types:
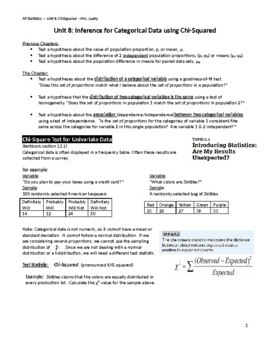
AP Statistics Unit 8 Guided Notes (Chi Squared) Editable Word Document
AP Statistics Unit 8 Guided Notes (Inference for Categorical Data - Chi Squared)This file is the editable word document version of the FREE download pdf version for the Unit 8 Notes.
Subjects:
Grades:
9th - 12th
Types:

research methods
concise notes that are guaranteed to help!!! contains: -notes -questions -essays -tables for quick revision
Subjects:
Grades:
9th - 12th
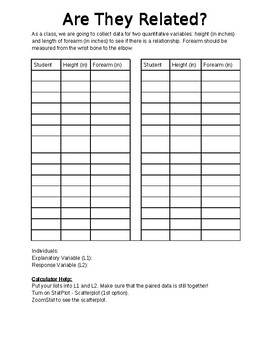
Correlation & Regression Notes/Activity
This activity takes students through the basics of correlation and regression. It was leveled for an AP Statistics class. It covers the topics of r, r^2, s, etc.
It is a scaffolded activity walking through the collection and analysis of data (height vs forearm length).
This activity is a word document and could be adapted for an algebra 1 class when introducing line of best fit.
Subjects:
Grades:
9th - 12th
Types:
Showing 1-24 of 30 results


