Stats: Inequities in Student Achievement & Poverty (PPT, NOTE SHEET-KEY, CFU)
- Zip
Products in this Bundle (4)
Bonus
Description
- Empower students to be able to interpret relevant data and make informed decisions based upon that data.
- Activity Based Learning where students experience first and then formalize their thoughts later.
- Extremely relevant
- Math discourse- a lot of room for conversation and critical thinking
- Problem solving, reasoning, representation, communication, and connections … Oh my!
When and Where
o Pre-Algebra/Algebra 1/Algebra 2: Linear Functions and Equations
o Data and Statistics: Analyzing Two-Variable Data
o I would even imagine throwing the data into an English/History Class
o When: Martin Luther King Week or Black History Month (Anytime is a great time to talk about inequities)
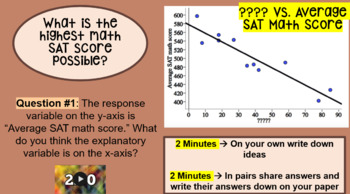
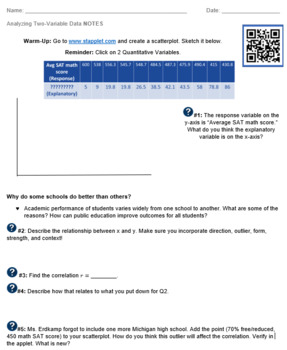
Lesson Summary: Students will be given data from a sample of Michigan High schools SAT Math scores. They will however not give them the x-axis which students will have time to inquire about. The x-axis is the % free/reduced lunch. They will then create a dotplot on stapplet.com which is a free applet to all students. They will then discuss topic like relationship between x and y, correlation, outliers affect correlation, confounding variables, least squares regression line (done for them by stapplet), slope, y-intercept, and residuals.
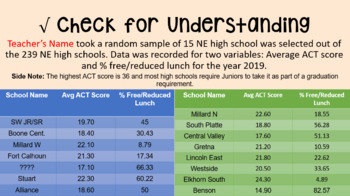
After they are finished, they will formalize the topics they learned either in pairs of whole class. Lastly, they will complete a CFU that has students look at their states data concerning act score/math achievement which is extremely relevant to them. There will be much mathematical discourse and conversation. Just be sure to make sure that they are not defined by this statistic and that they get out of it that just because there is a strong correlation does not mean there is a causal relationship. We did an observation study not an experiment.


