4 results
High school statistics webquests for Microsoft Word

Analyzing Misleading Graphs
Students are to find a graph online. They are given a url and other resources on how to find it. From there, they are to write a paragraph analyzing the validity of the graph. They are to include the title, resource, what the article is trying to convey, how it is/is not misleading, and at least two suggestions on how to make the graph more clear. Since this is a web-based assignment, it would be perfect for distance learning. Included:Student directions (in word doc so editable for your classro
Subjects:
Grades:
7th - 12th
Types:
CCSS:

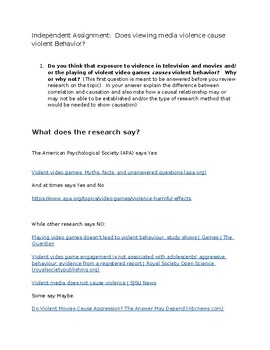
Does viewing media violence cause violent behavior? What does the research say?
This product asks students to weigh in on the possible causal connection between exposure to violent media and violent behavior. Students are asked to state their thoughts both prior to and after reviewing the existing literature on the topic. Research articles present arguments both affirming and denying the causal connection. Multiple meta-analysis article links are also provided. Students are asked to note if their stance on the issue changed after viewing the research and to explain why
Subjects:
Grades:
9th - 12th, Higher Education, Adult Education
Types:

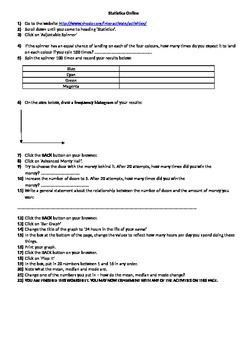
Statistics Webquest / Internet Interactive Activities
This worksheet provides students with a number of websites that feature interactive statistics activities. Students are required to complete activities and answer questions based upon these websites.
Subjects:
Grades:
5th - 10th
Types:

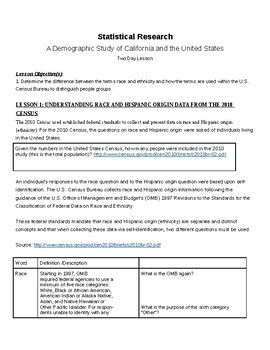
SAT Prep: Charts, Tables, and Graphs using U.S. Census Data Study
This lesson uses data from the 2010 U.S. Census to allow students to access numbers and data in a social science classroom. The lesson is a 2 day mini-unit centered on working with charts, graphs, and tables (serves extremely well for SAT and ACT prep). This cross-curricular lesson draws meaningful parallels between math and social science, and the necessity of bringing these subjects together. The lesson uses a comparative look at Census data for California and the United States as a whole, but
Subjects:
Grades:
9th - 12th
Types:
Showing 1-4 of 4 results


