21 results
High school statistics laboratories for Microsoft Word

Candy Probability: Discovery of EXPERIMENTAL vs. THEORETICAL Probability
Middle Schoolers LOVE probability!
This is a GREAT lesson around Halloween when the kids are already hyped up on sugar and want to 'talk' to their classmates.
This activity allows the students to DISCOVER the differences between EXPERIMENTAL and THEORETICAL probability and connect it to everyday experiences. The probability lesson lends itself to fractions, decimals, percents, data collection, rational & irrational numbers, statistical graphs (box and whiskers, frequency tables...), measu
Subjects:
Grades:
5th - 9th
Types:
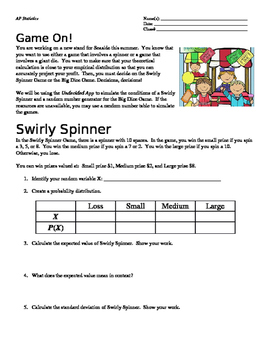
Game On! Hypothesis Testing: 1-Sample t-Test for Means Lab
This lab asks students to apply concepts of 1-sample t-test of means in a real world context. They are able to play/simulate games and determine if their theoretical calculation is accurate.
This lab integrates hypothesis testing based on two carnival games. Spiraling expected value and random variable topics from previous chapters will help themto prepare them with a "big picture" when it comes to the AP Statistics Exam.
(For the high flyers: It also asks students to develop of higher orde
Subjects:
Grades:
10th - 12th
Types:
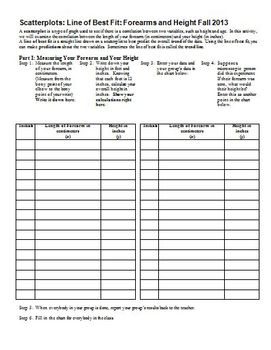
Scatterplots Linear Regression Line of Best Fit Forearms & Height (Editable)
After teaching my students about scatterplots, correlation, and the line of best fit, I take a day for them to do a hands-on lab, in which they measure their height (in inches) and their forearm length (from the tip of their elbow, to the bony point on their wrist), and we plot the class data, write the equation of the line of best fit, and then use the equation generated both forwards and backwards. They will need 45 minutes to an hour to do this in class.
I have found that if the students br
Subjects:
Grades:
7th - 12th
Types:
Chi Square Lab for AP Biology
I use this activity to introduce chi square to my students in AP Biology.It scaffolds their learning so that we walk through the definitions and basic concepts, then dive right into practice problems. We used AP biology examples, M&M color distributions, and practice genetics problems to understand how to calculate and use the chi square value.The students are always super engaged throughout the lesson and generate their own data for may of the components of the lab.By the end of the lesson,
Subjects:
Grades:
10th - 12th
Types:
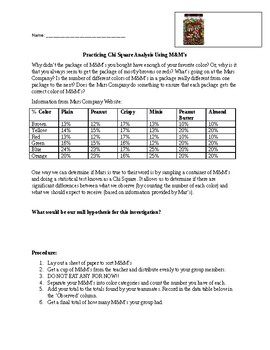
M&M Chi Square Lab
Students practice Chi square using packages of M&M's.
Subjects:
Grades:
11th - 12th
Types:
Gapminder Global and Local Energy Lab Activity
In this lab students will use an internet based charting software to research topics and implications of energy on local and global scales. Students will examine the energy cost and sources of their own state (prefilled for Illinois) and analyze changes in the energy use of United States and other countries selected by student. Students will demonstrate knowledge by responding to questions and writing prompts requiring analysis, justification and evaluation.
This lab is great for high level hig
Subjects:
Grades:
8th - 12th, Higher Education, Adult Education
Types:
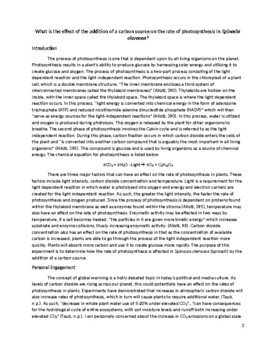
Internal Assessment Example: IB Biology SL/HL (Photosynthesis)
This is an example Internal Assessment that can be used in the classroom to have students utilize the IA rubric for grading. Having students justify their rubric choices with samples from the text will assist students in understanding the requirements of the IA.
Subjects:
Grades:
11th - 12th, Higher Education
Types:
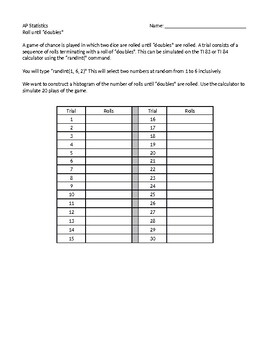
AP Statistics: Roll Until Doubles Activity
This is an experiment that has students simulate rolling two dice using their graphing calculators. They will collect their own data then organize and display the class set of data. Students will then attempt to draw conclusions about game theory based on the data collected. AP Statistics Unit 1: Exploring One-Variable Data. AP Statistics Unit 3: Collecting Data.
Subjects:
Grades:
10th - 12th
Types:
CCSS:
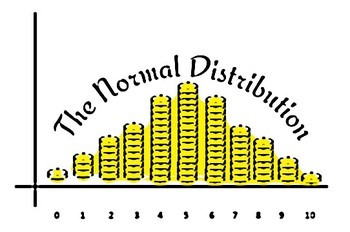
The Normal Distribution - Made Easy
This activity requires students to flip a coin 100 times, exchange data with other students, and create a frequency table based on the results. Students should be able to recognize the structure of a normal distribution curve and explain how the associated statistics � mean, median, mode, etc. � relate to the probability of flipping a coin. Students practice creating frequency tables, constructing histograms, and interpreting data. Teachers may use this activity
Subjects:
Grades:
7th - 12th
Types:
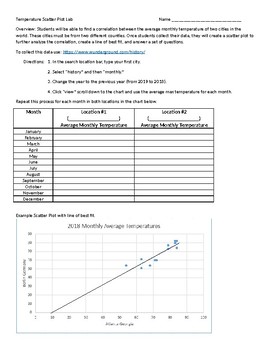
Temperature Correlation Lab
Students will be able to find a correlation between the average monthly temperature of two cities in the world. Once students collect their data, they will create a scatter plot to further analyze the correlation, create a line of best fit, and answer a set of questions. I usually allow for two class periods so the kids aren't rushed. It takes my kids around an hour and a half to complete the lab. This is a Word Document so you can edit as you please!!
Subjects:
Grades:
8th - 12th
Types:
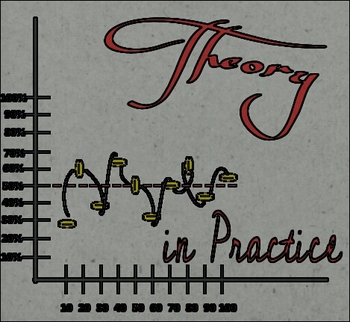
Theory in Practice
This activity requires students to flip a coin 100 times and calculate the cumulative probability for each trial of ten. Students should begin to develop the concept of theoretical versus experimental probability as the cumulative number of flips increases. Recognizing independent events, graphing scatter plots, and calculating percentages are skills students will practice during this activity. Teachers may use this activity as an introductory lesson for a unit on probability, in a statistics
Subjects:
Grades:
7th - 12th
Types:
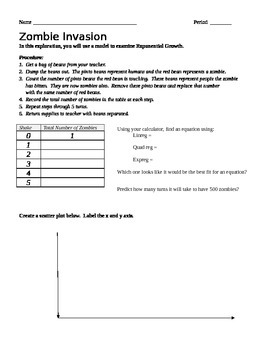
Zombie Invasion--Exponential Growth
students use 2 diff colored beans to replicate zombie invasion. Zombie beans touch another bean and make them zombies. They graph and find equation to fit. Paper folding on same lab.
Subjects:
Grades:
9th - 12th
Types:
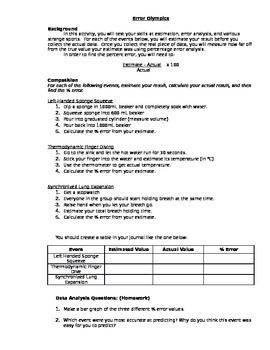
Error Olympics
Students will actively estimate and calculate values (ex. the temperature of water) to determine percent error. This is a great active lesson since kids will be moving from station to station to complete their data collection, ideally in small groups.
Aside from simply learning to calculate percent error, students will also learn the value of accurate data collection.
Paper "Olympic Medals" are also included to award the students at the end whose estimates were closest to their actual val
Subjects:
Grades:
7th - 10th
Types:
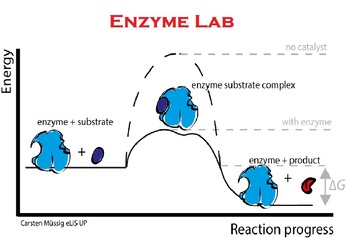
Enzyme Lab
This lab challenges students in experimental design, lab skills, and regression analysis as they investigate how an enzyme of their choice works.
Subjects:
Grades:
10th - 12th
Types:
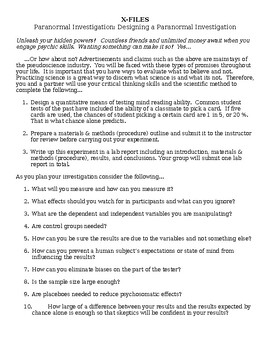
AP - X-Files Lab Sheet Directions
The lab sheet with directions I give to the students.
Subjects:
Grades:
10th - 12th
Types:

Powerball Lottery Lab
This is a lab for statistics. Topics covered include histograms, specifically histograms with uniform distribution. Students will also explore theoretical and empirical probability as well as expected values.
I created this lab to be used with Statcrunch but it can be adapted for Excel or any other software that students can use to manipulate large files. You can go to this link (http://www.nc-educationlottery.org/powerball.aspx) and then click "Download Results" to get a csv file of all the
Subjects:
Grades:
9th - 12th, Higher Education, Adult Education
Types:
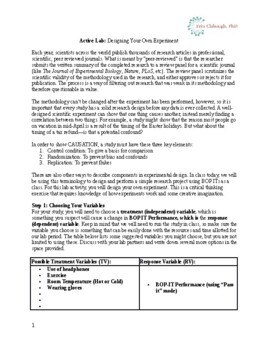
BOP-IT Experimental Design Lab Group Activity w/Excel Statistics BIOLOGY PSYCH
Science is best taught by doing science! This experimental design lab walks students through designing a proper science experiment using BOP-it toys, including the actual data collection and subsequent analysis using Excel. The activity is collaborative, student-driven, hands-on, and the outcome is not predetermined. First, the lab teaches the required elements to determine cause and effect. Then, the entire class chooses the independent variable and lab groups are assigned to an experimental co
Subjects:
Grades:
10th - 12th, Higher Education
Types:
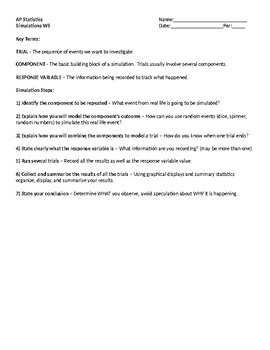
AP Statistics: Simulation Lab Worksheet
This activity provides the basics of creating and running a random simulation. There are key terms as well as a defined procedure to follow. The questions are scaffolded to assist in completion and the level of scaffolding decreases as the worksheet progresses. AP Statistics Unit 3: Collecting Data.
Subjects:
Grades:
10th - 12th
CCSS:
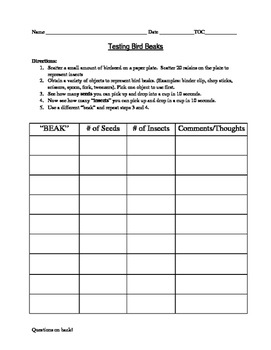
Bird Beak Variation Lab
This lab is a great inquiry activity demonstrating variation in bird beaks. This relates directly to instruction involving Darwin, natural selection, and variation.
Subjects:
Grades:
5th - 9th
Types:
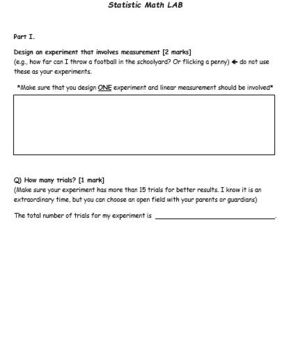
Statistic Math Lab (for Jr high math)
This is an activity-based statistic lab for grade 7, 8, or 9 statistics.The worksheet includes problems thatmainly focus on the following outcomes:1. Mean2. Median3. Mode4. RangeThis worksheet works best as a review activity near the end of the statistic unit.
Subjects:
Grades:
7th - 9th
Types:
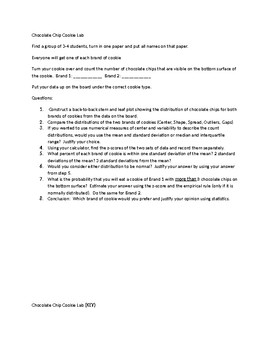
Which Chocolate Chip Cookie Would You Eat?
For Statistics: Lab where kids will make a back-to-back stemplot, analyze it using statistics and conclude with reasoning why they chose the brand they chose. (key terms used: stemplot, center, shape, spread, right skewed, left skewed, symmetric, mean, median, iqr, range, standard deviation, z-score)
Subjects:
Grades:
10th - 12th, Higher Education
Types:
Showing 1-21 of 21 results


